Century 21 People’s Choice Realty Inc., Brokerage
120 MATHESON BLVD E #103
MISSISSAUGA, Ontario
L4Z 1X1


Cambridge, N1S 0C7
$1,248,000$000000
Listed by RE/MAX TWIN CITY REALTY INC..
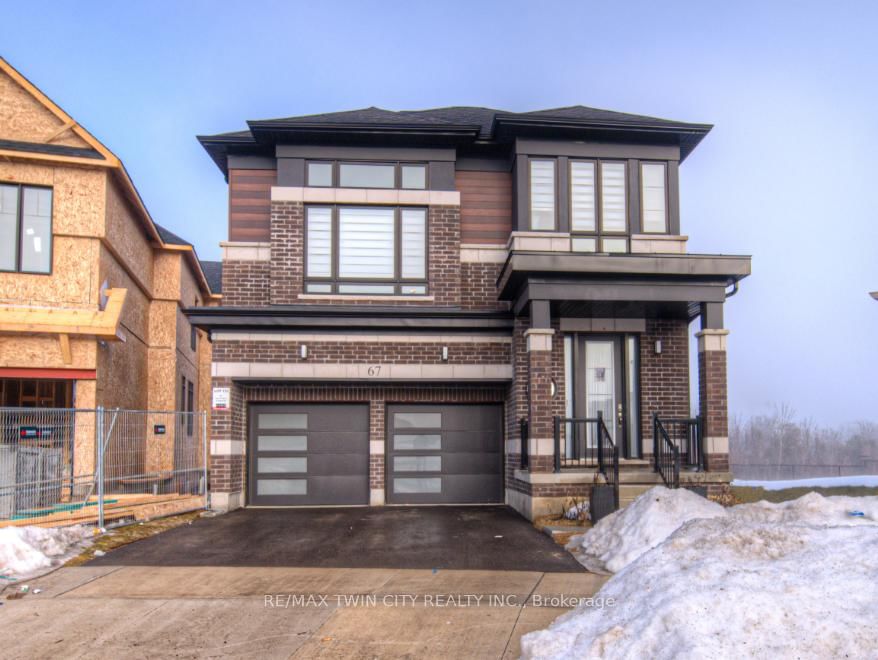
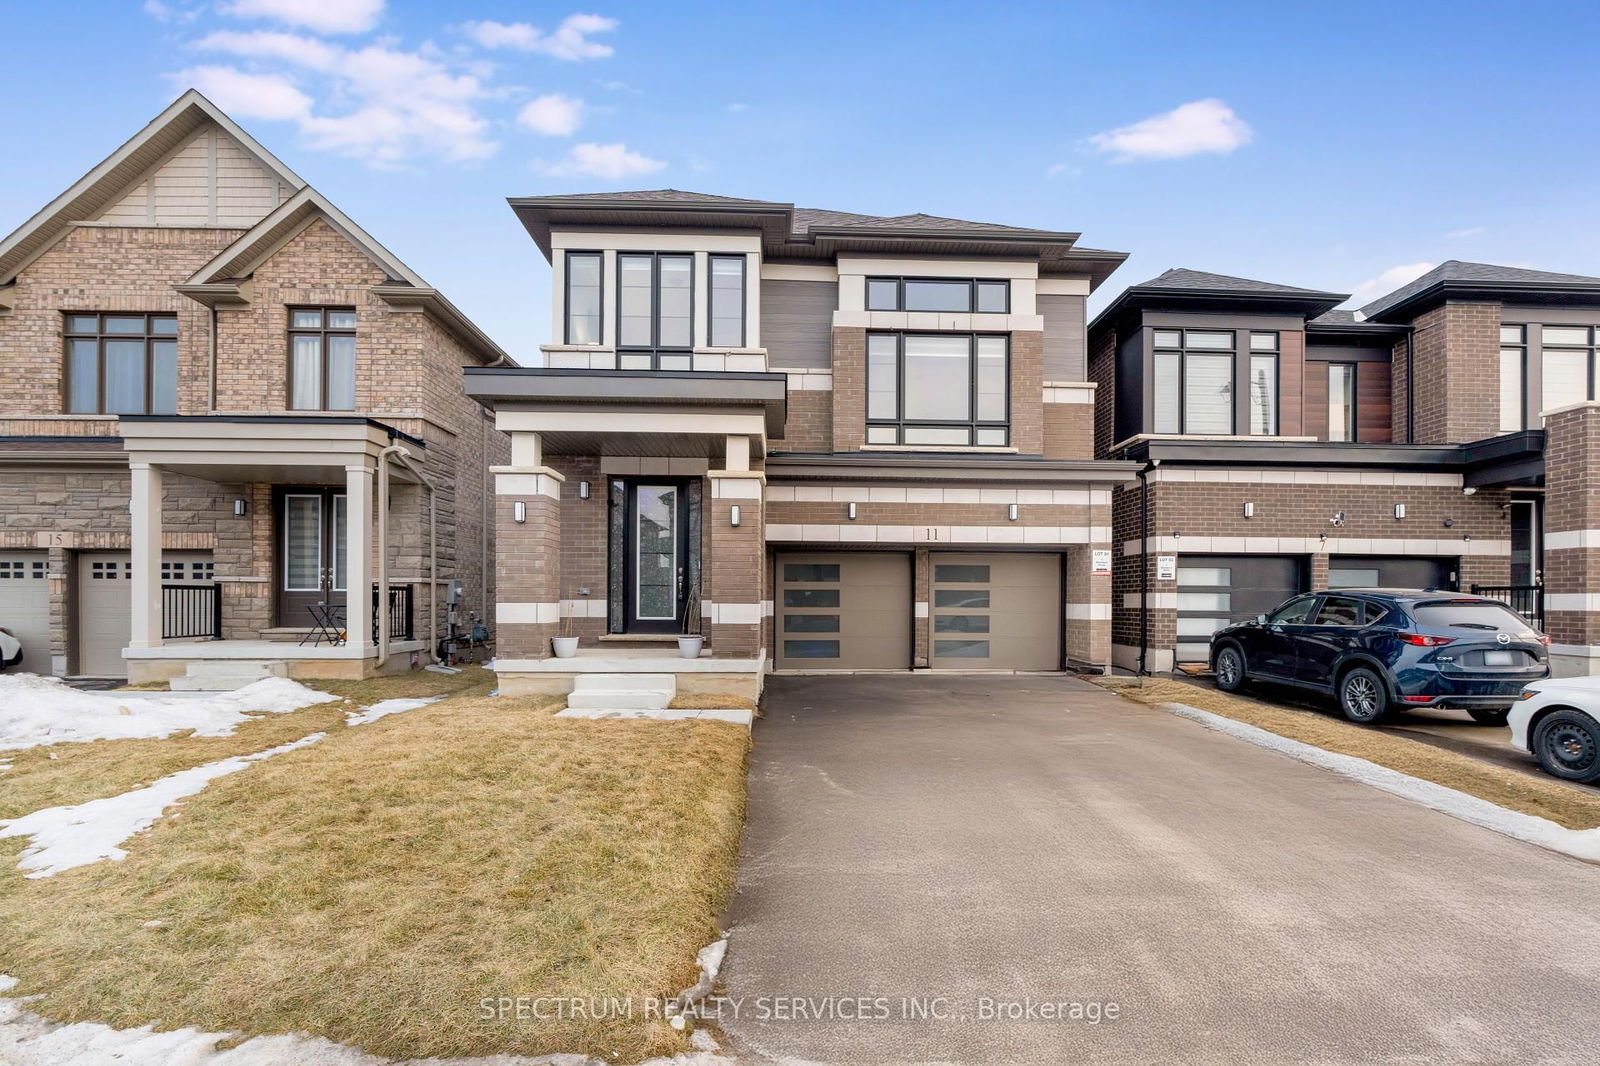
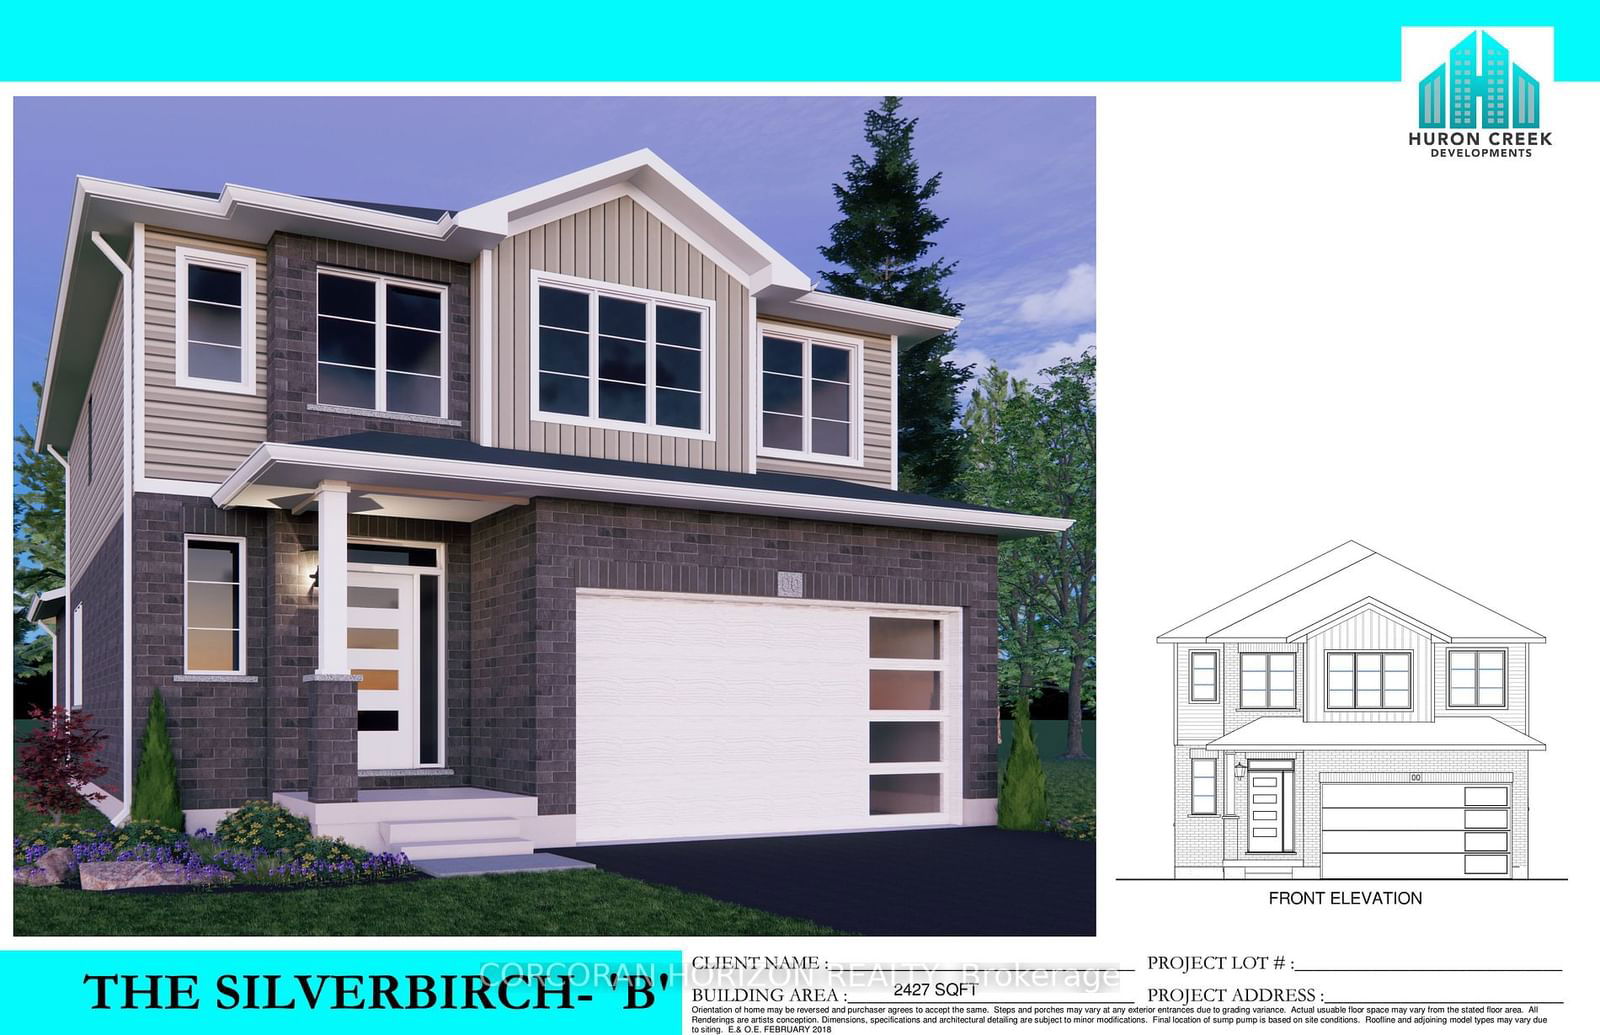
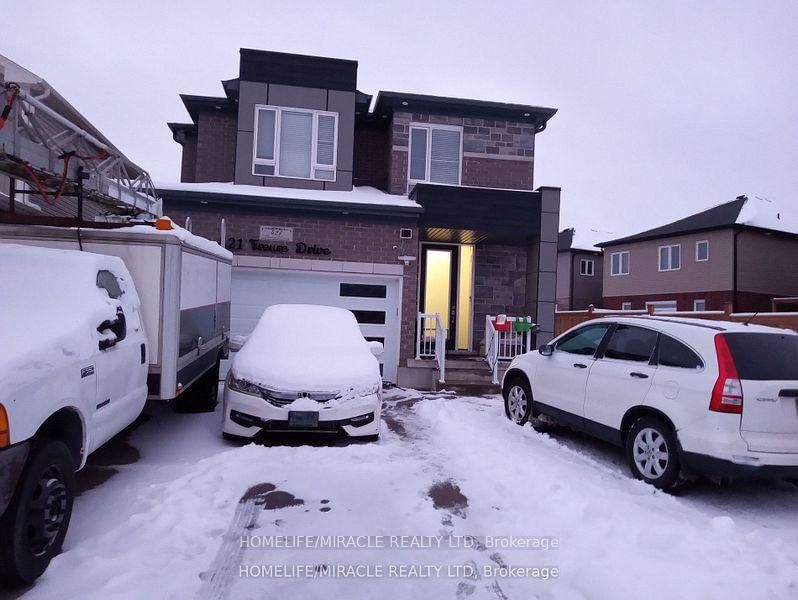
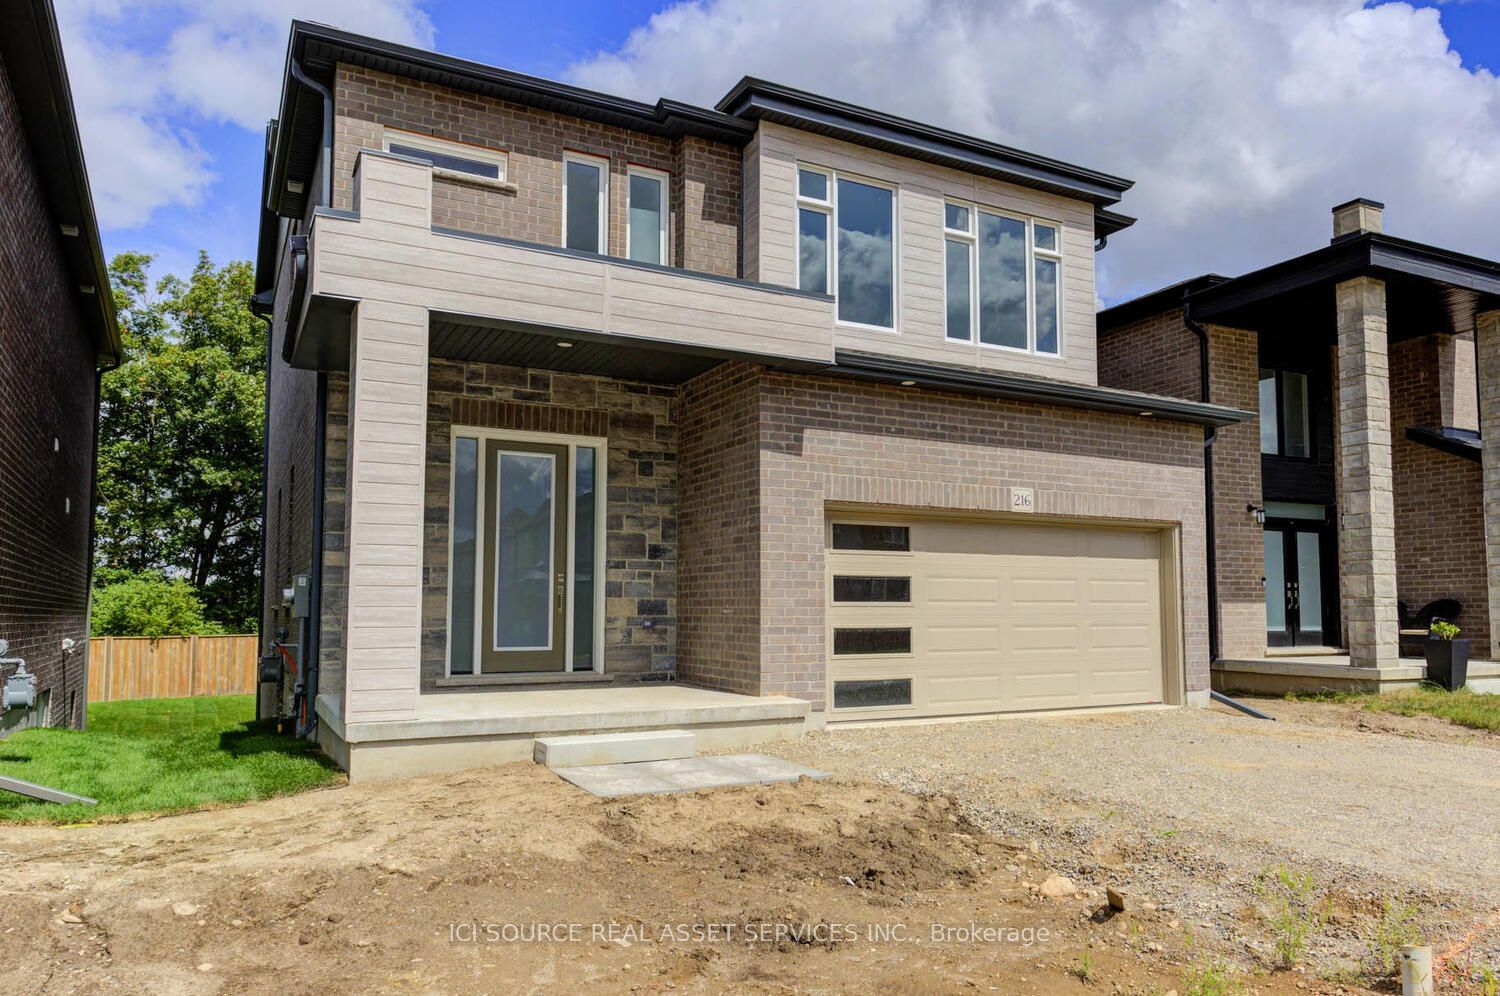
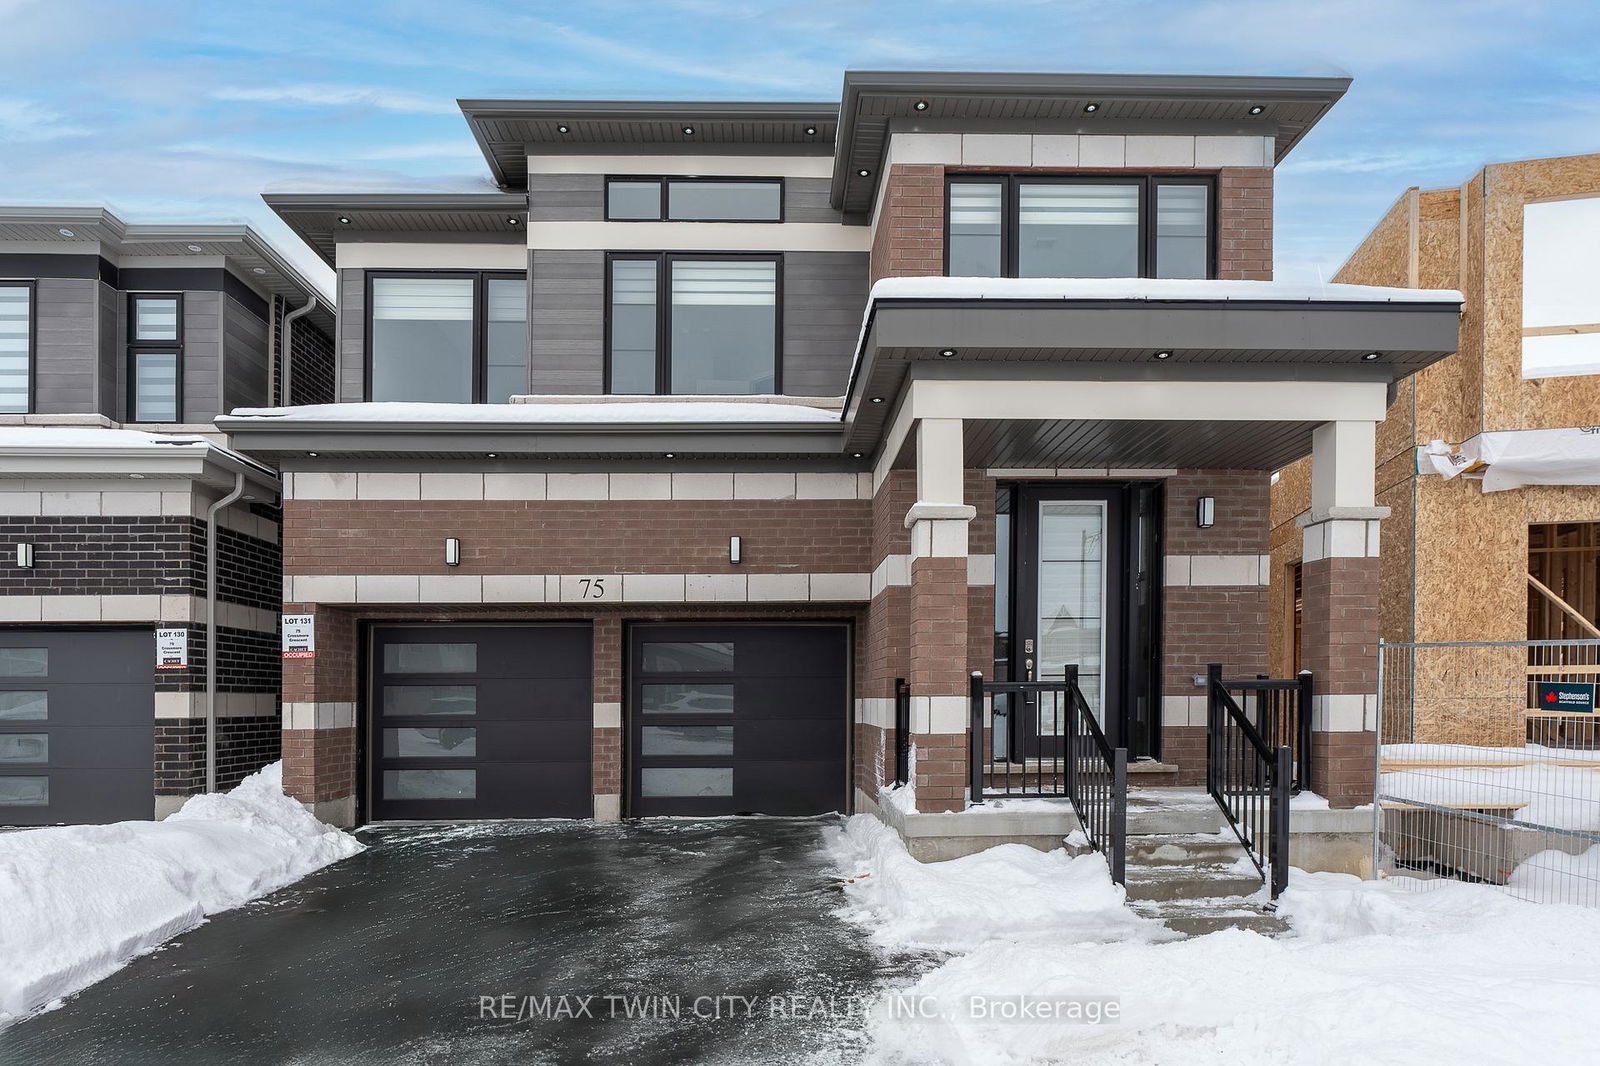
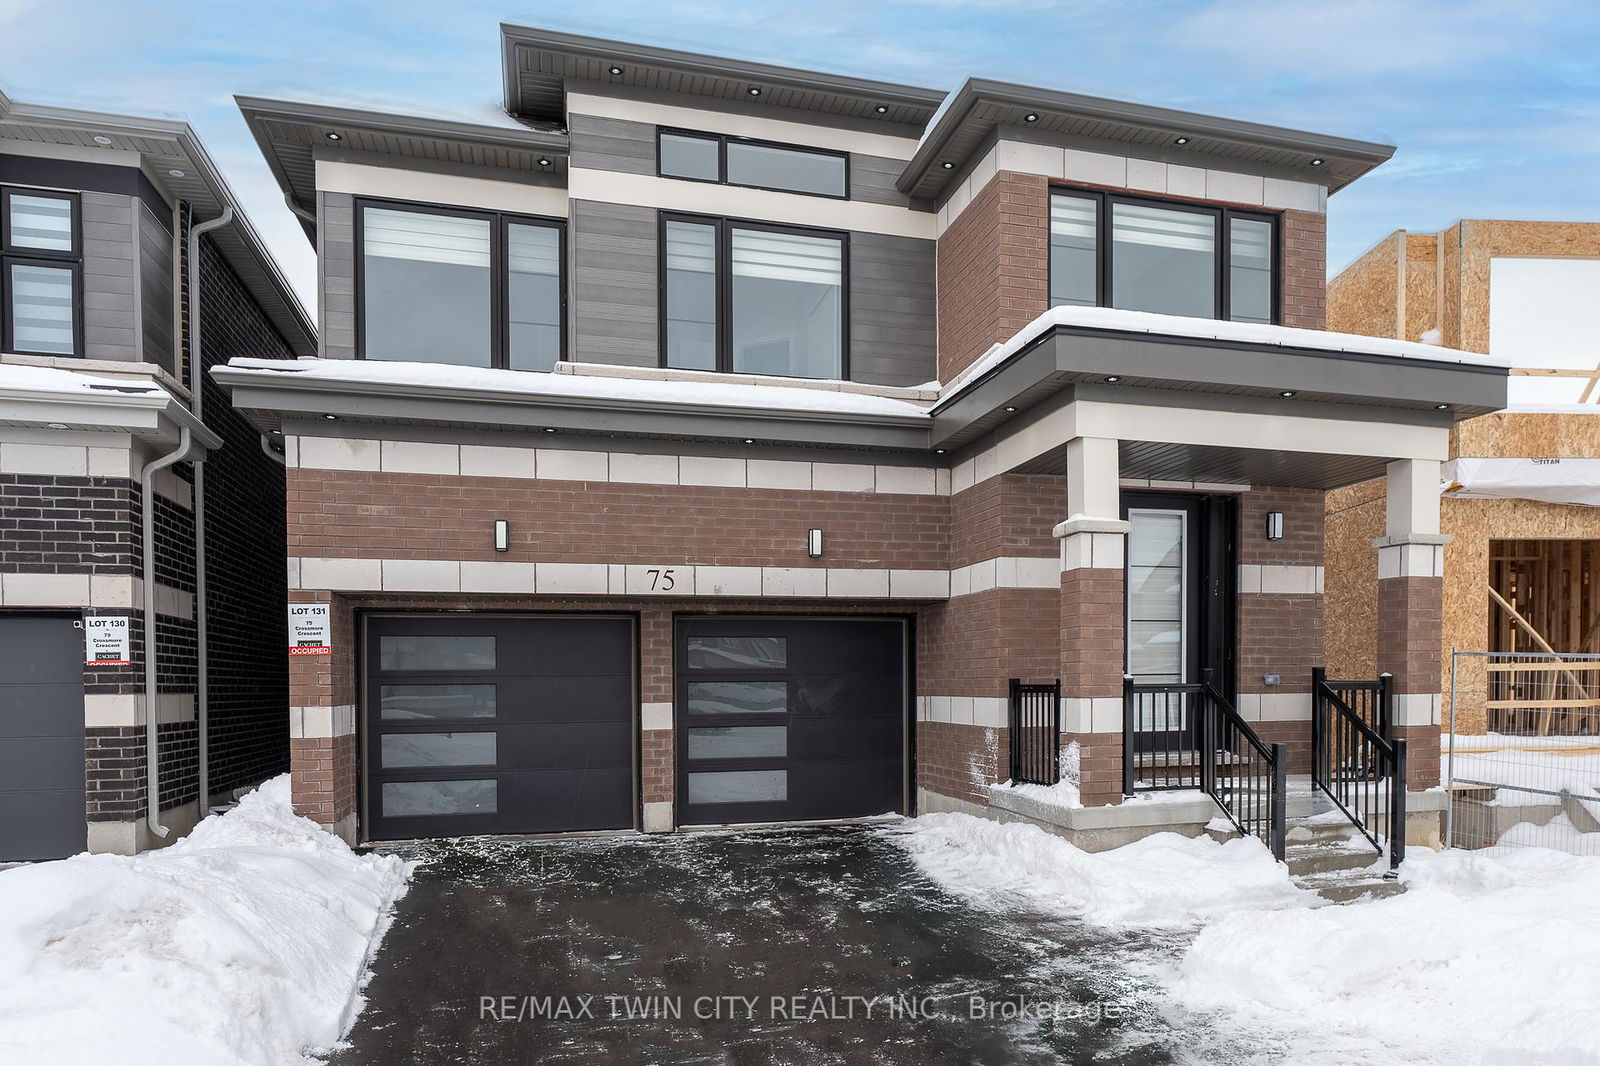
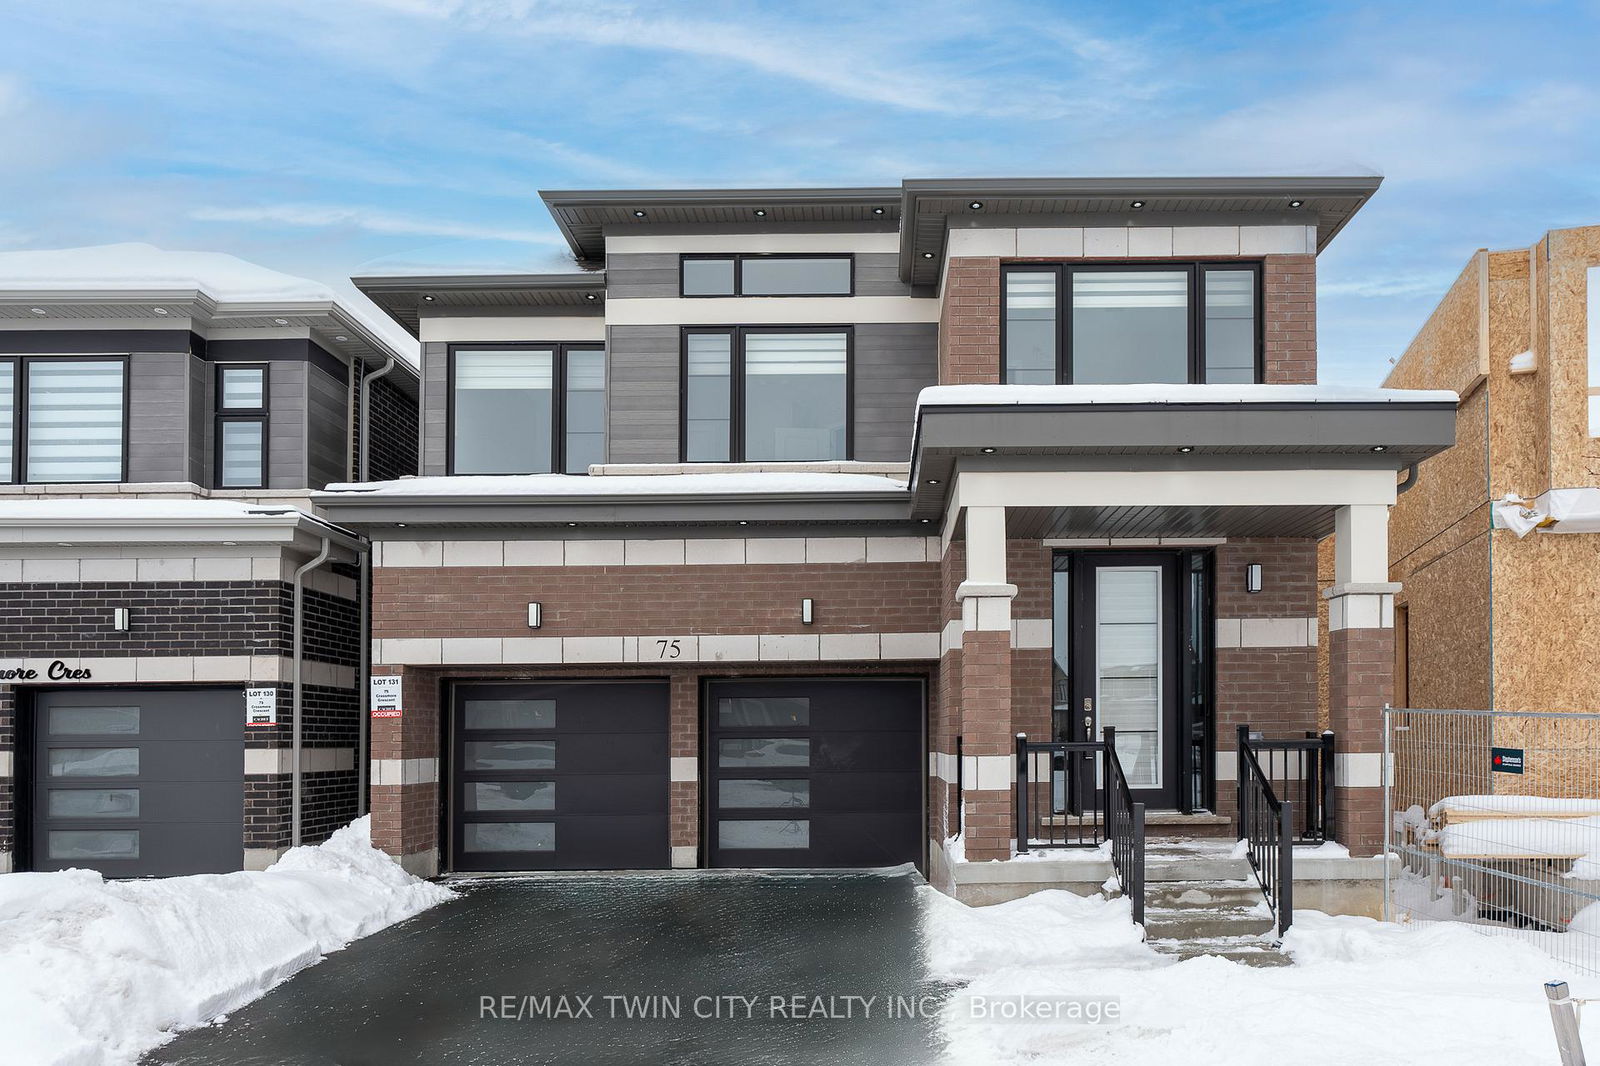
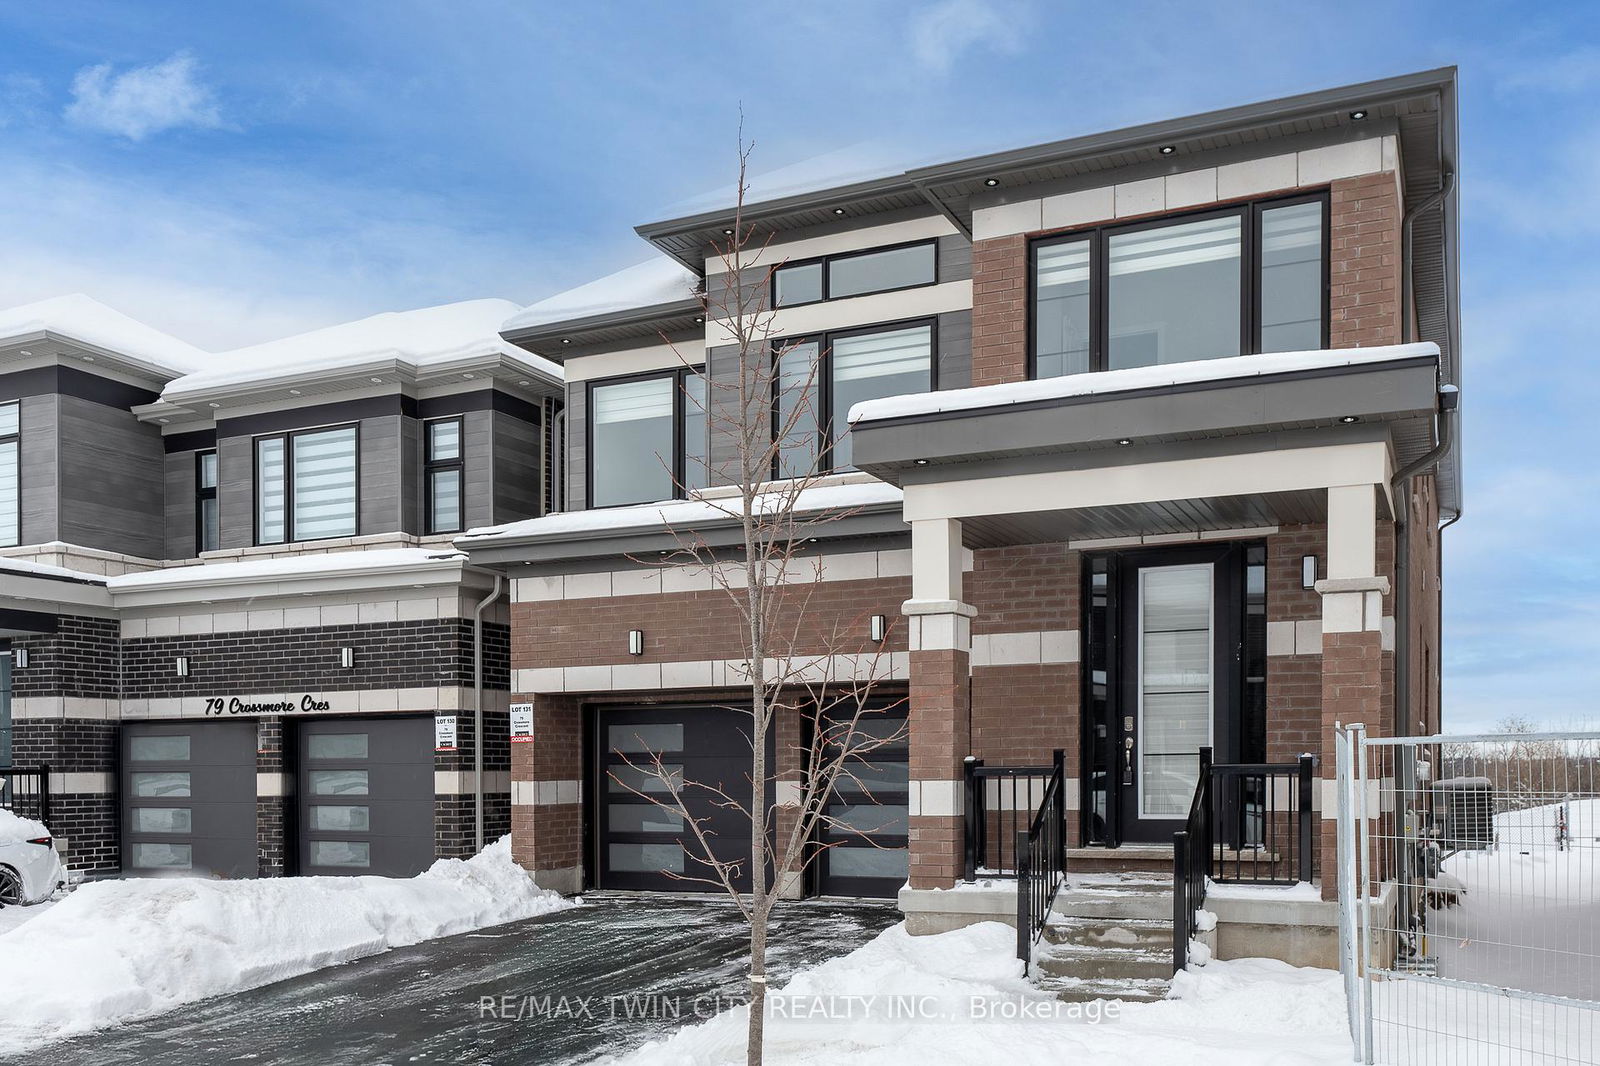
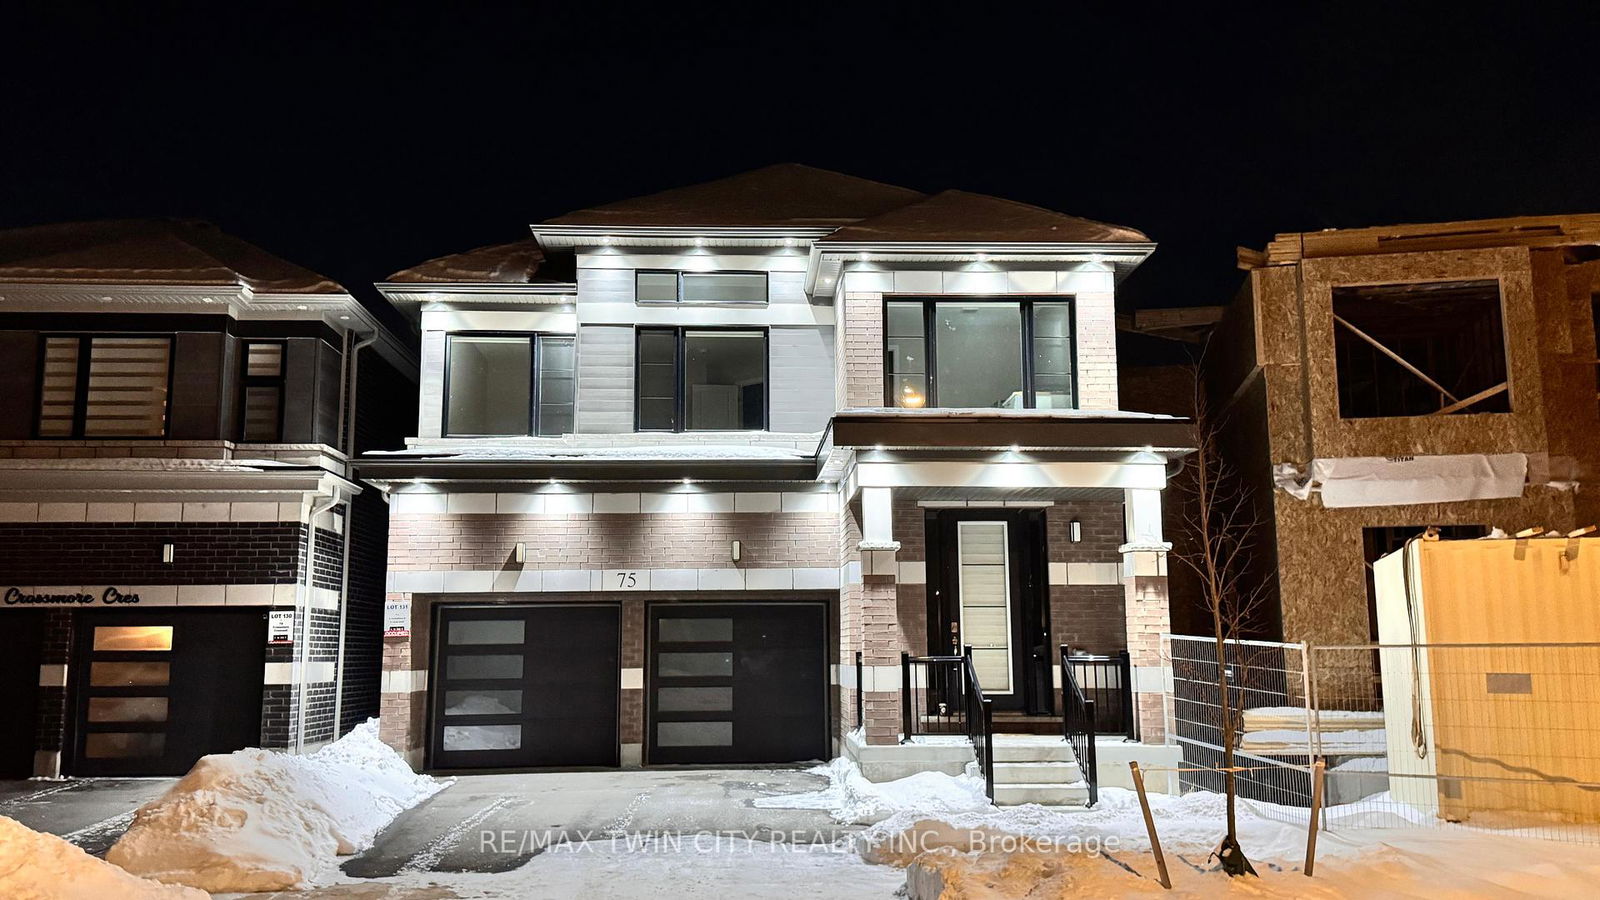
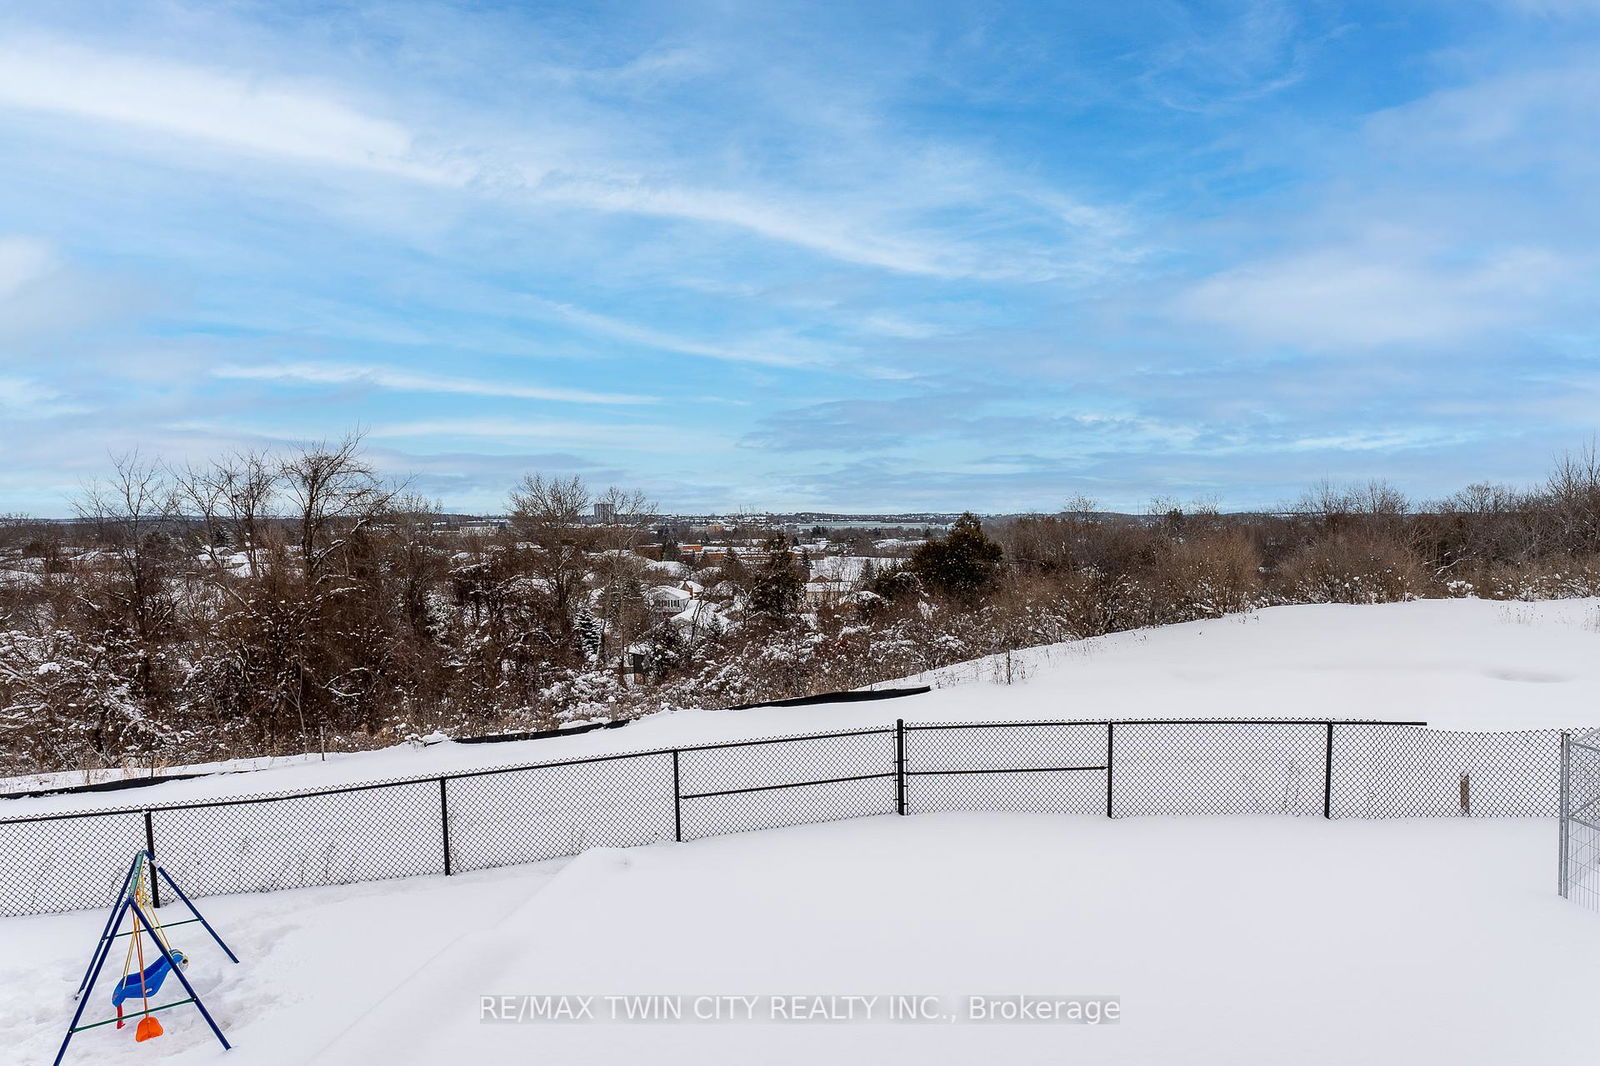
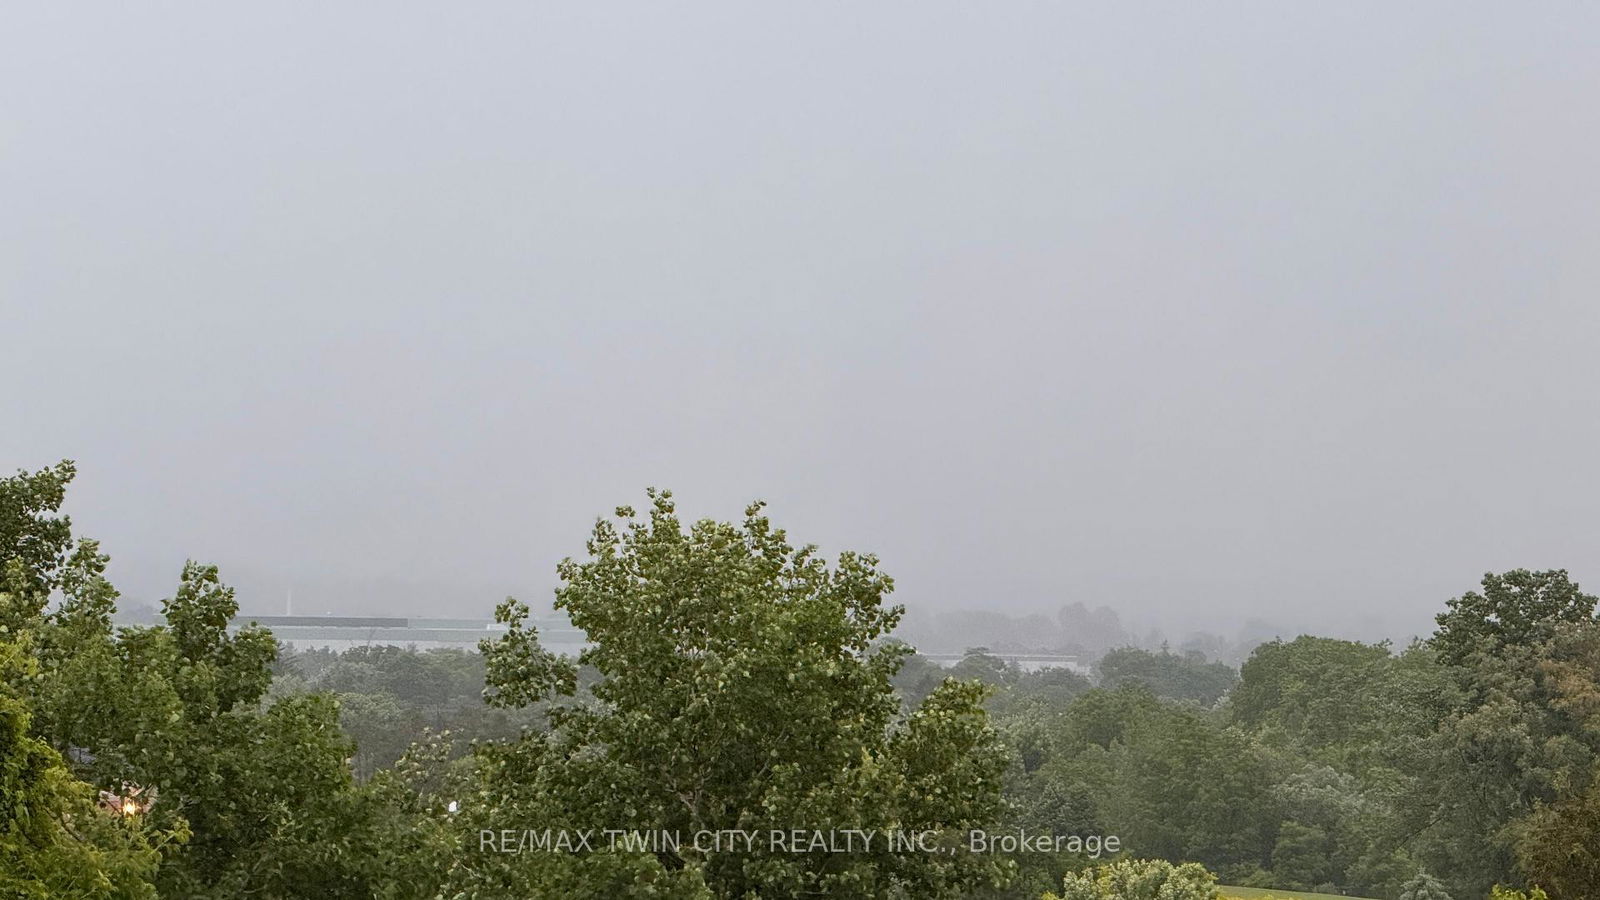
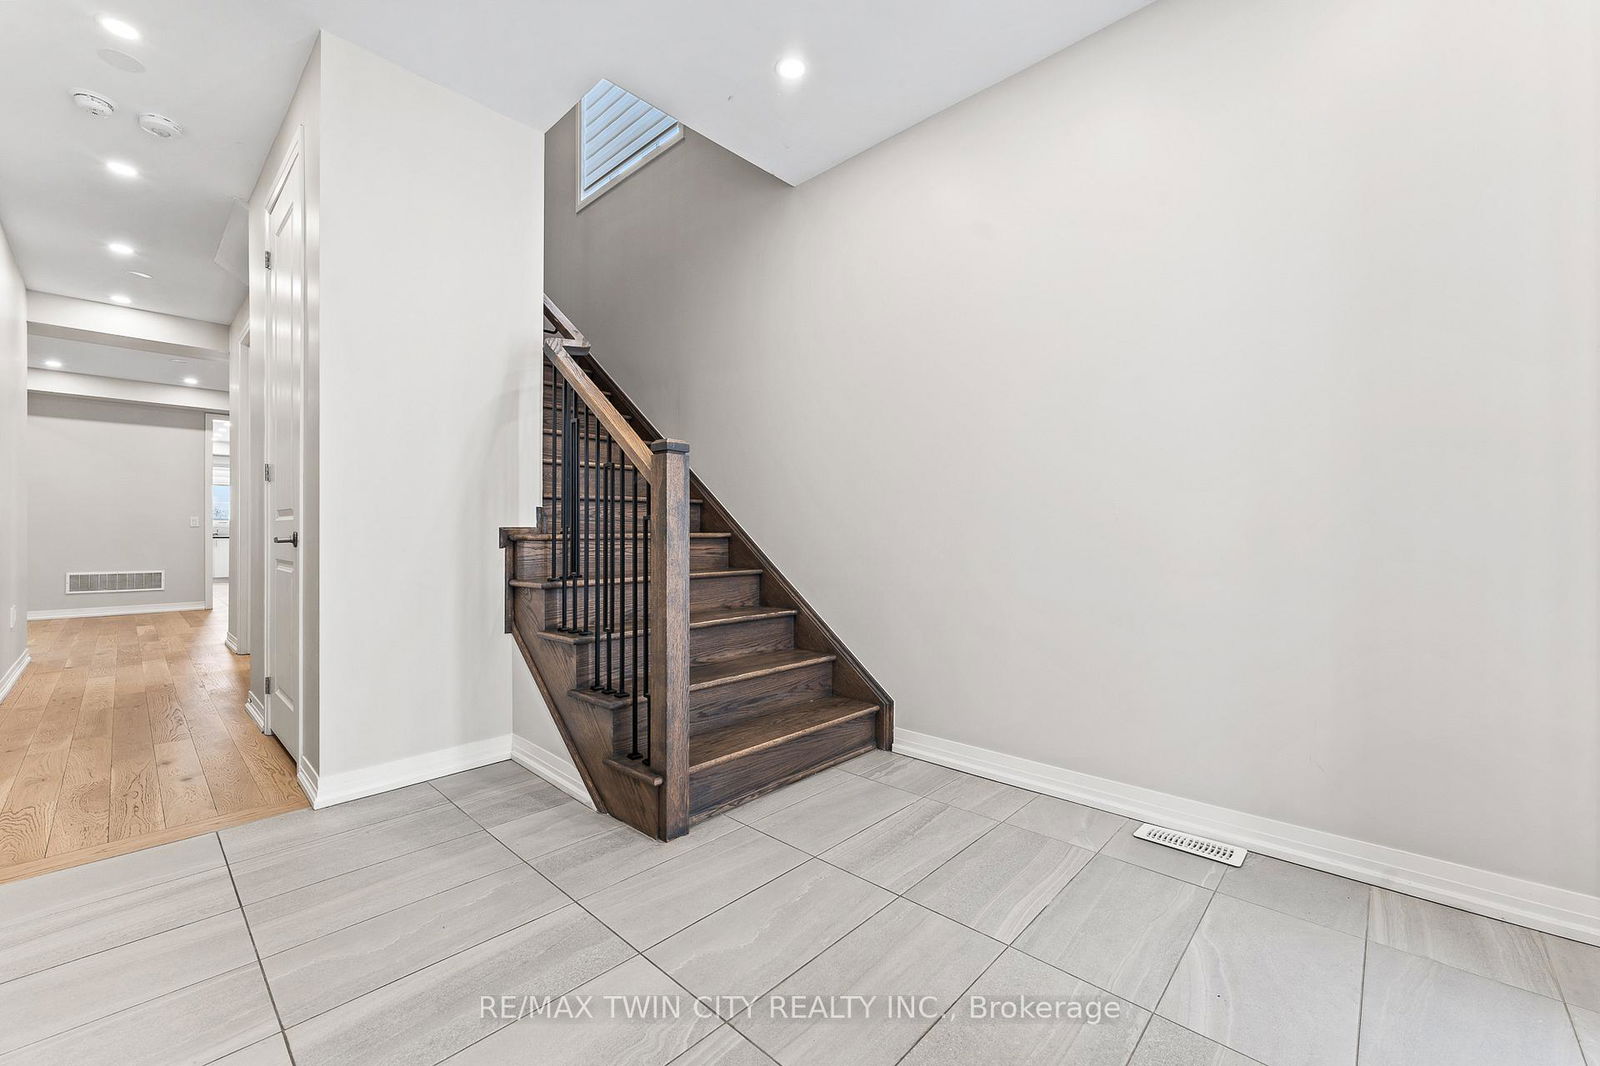
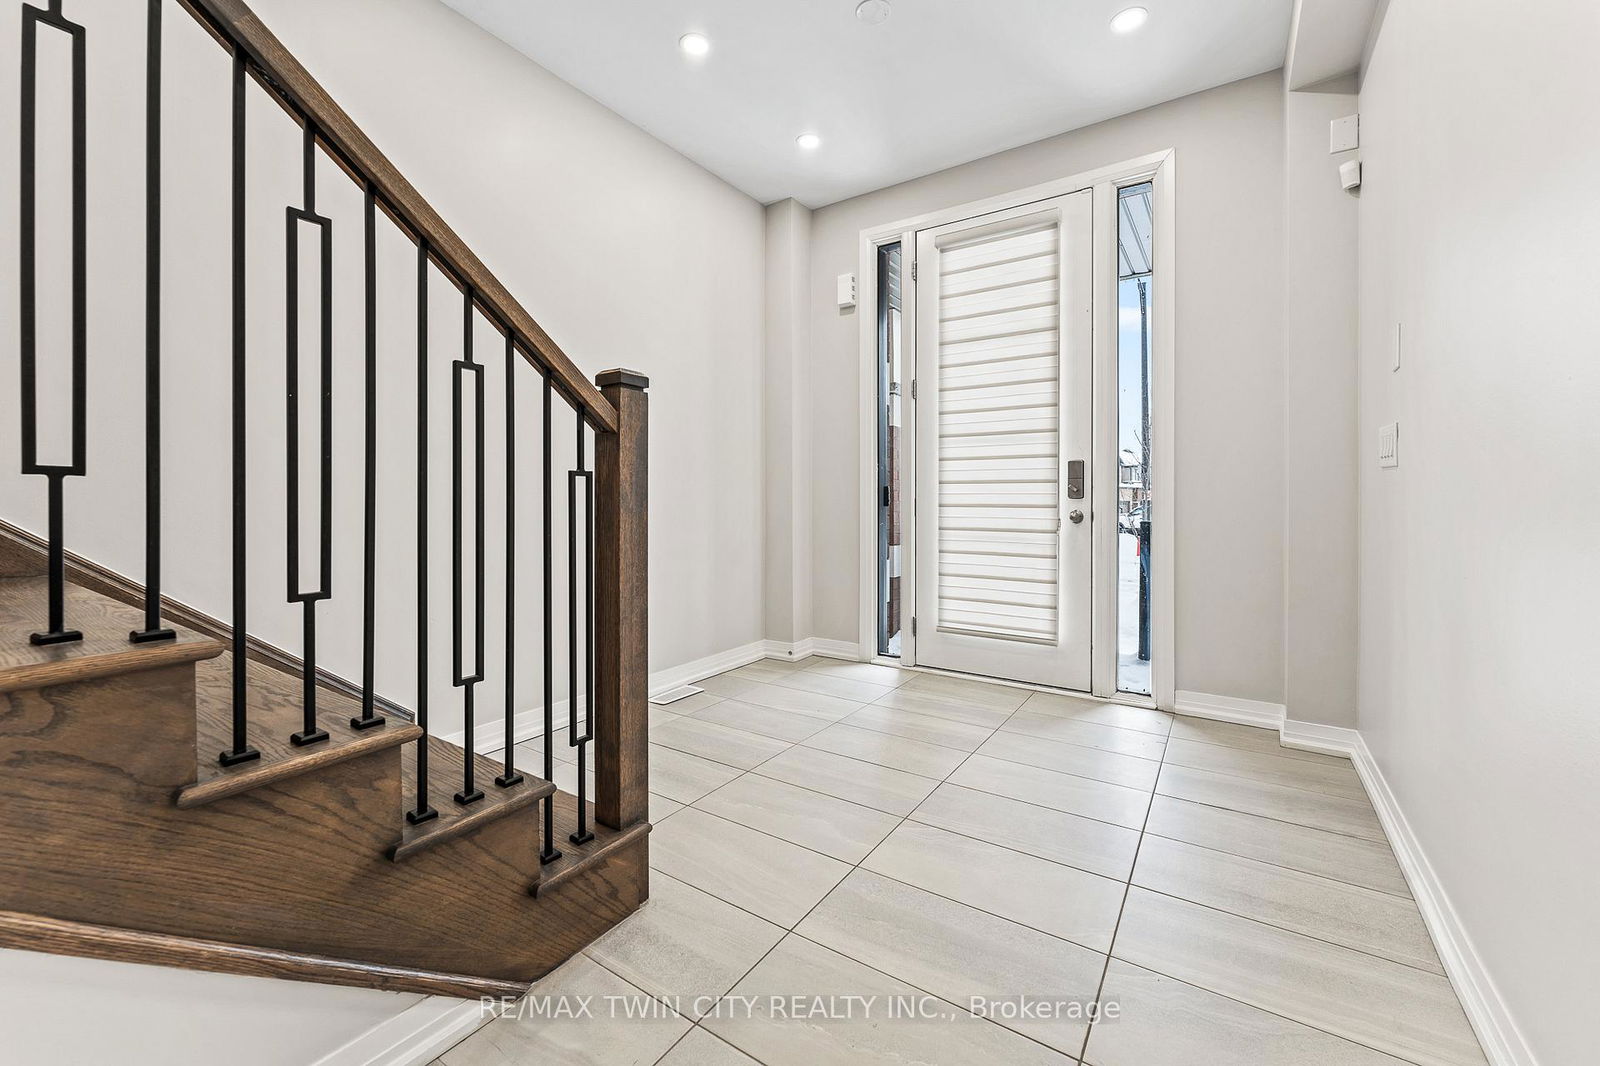
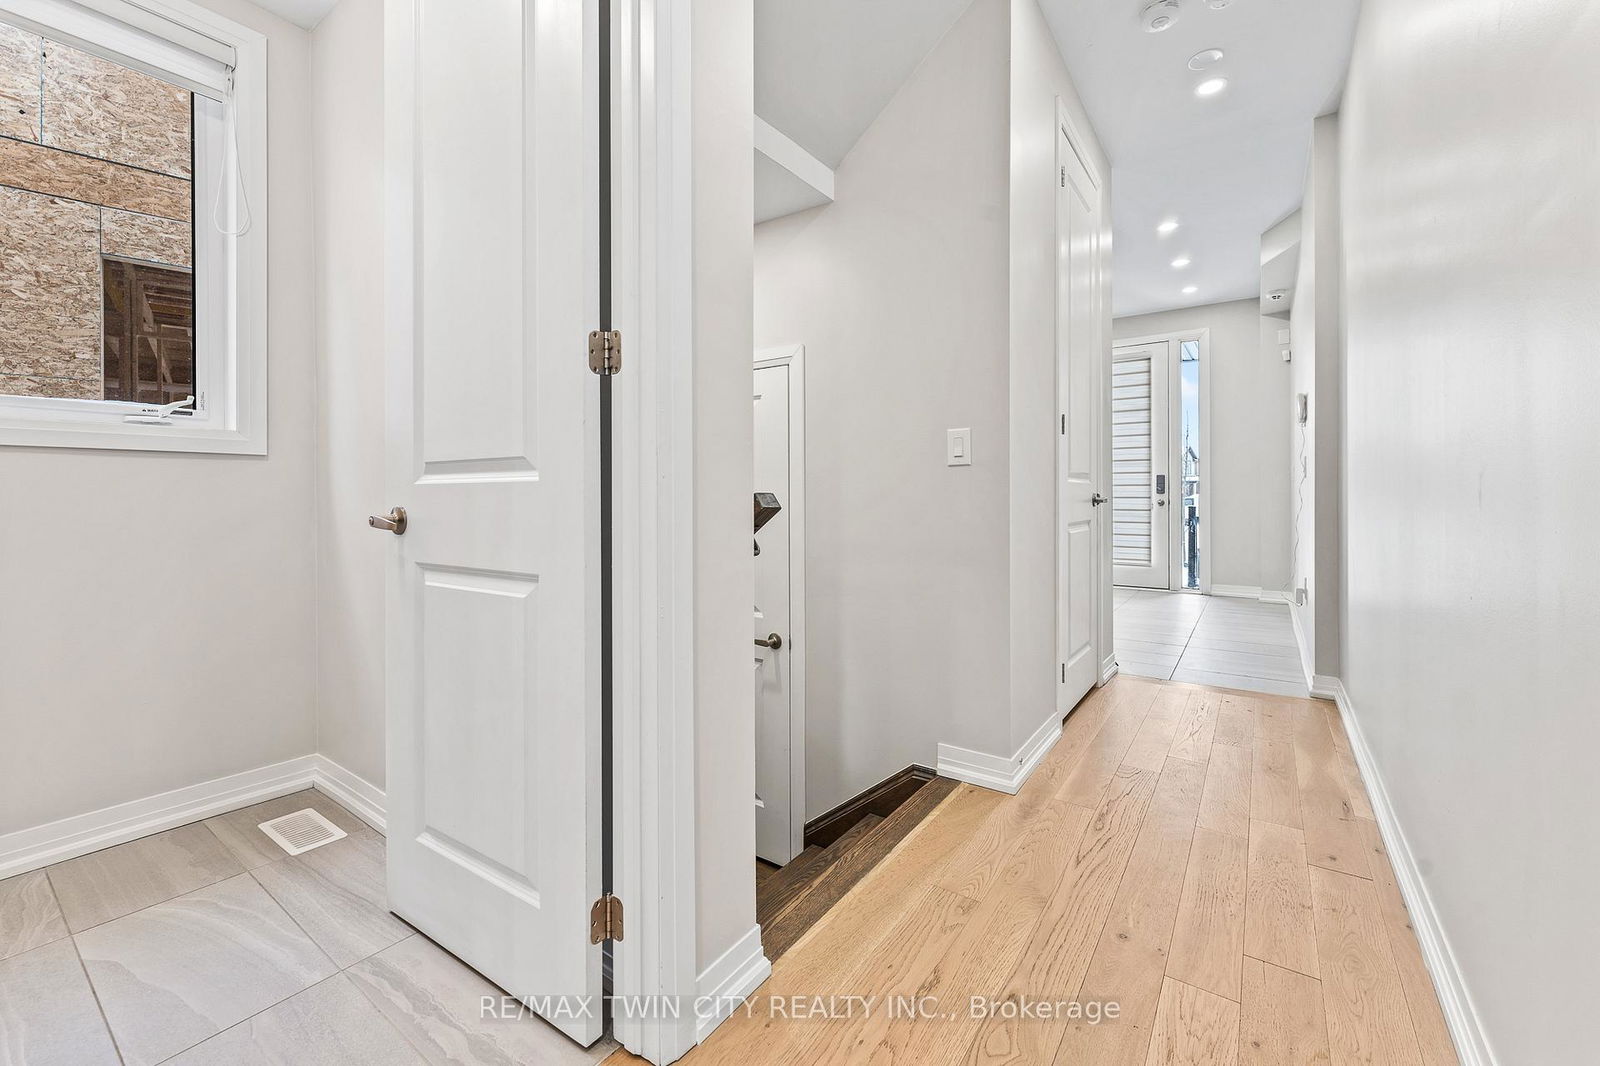
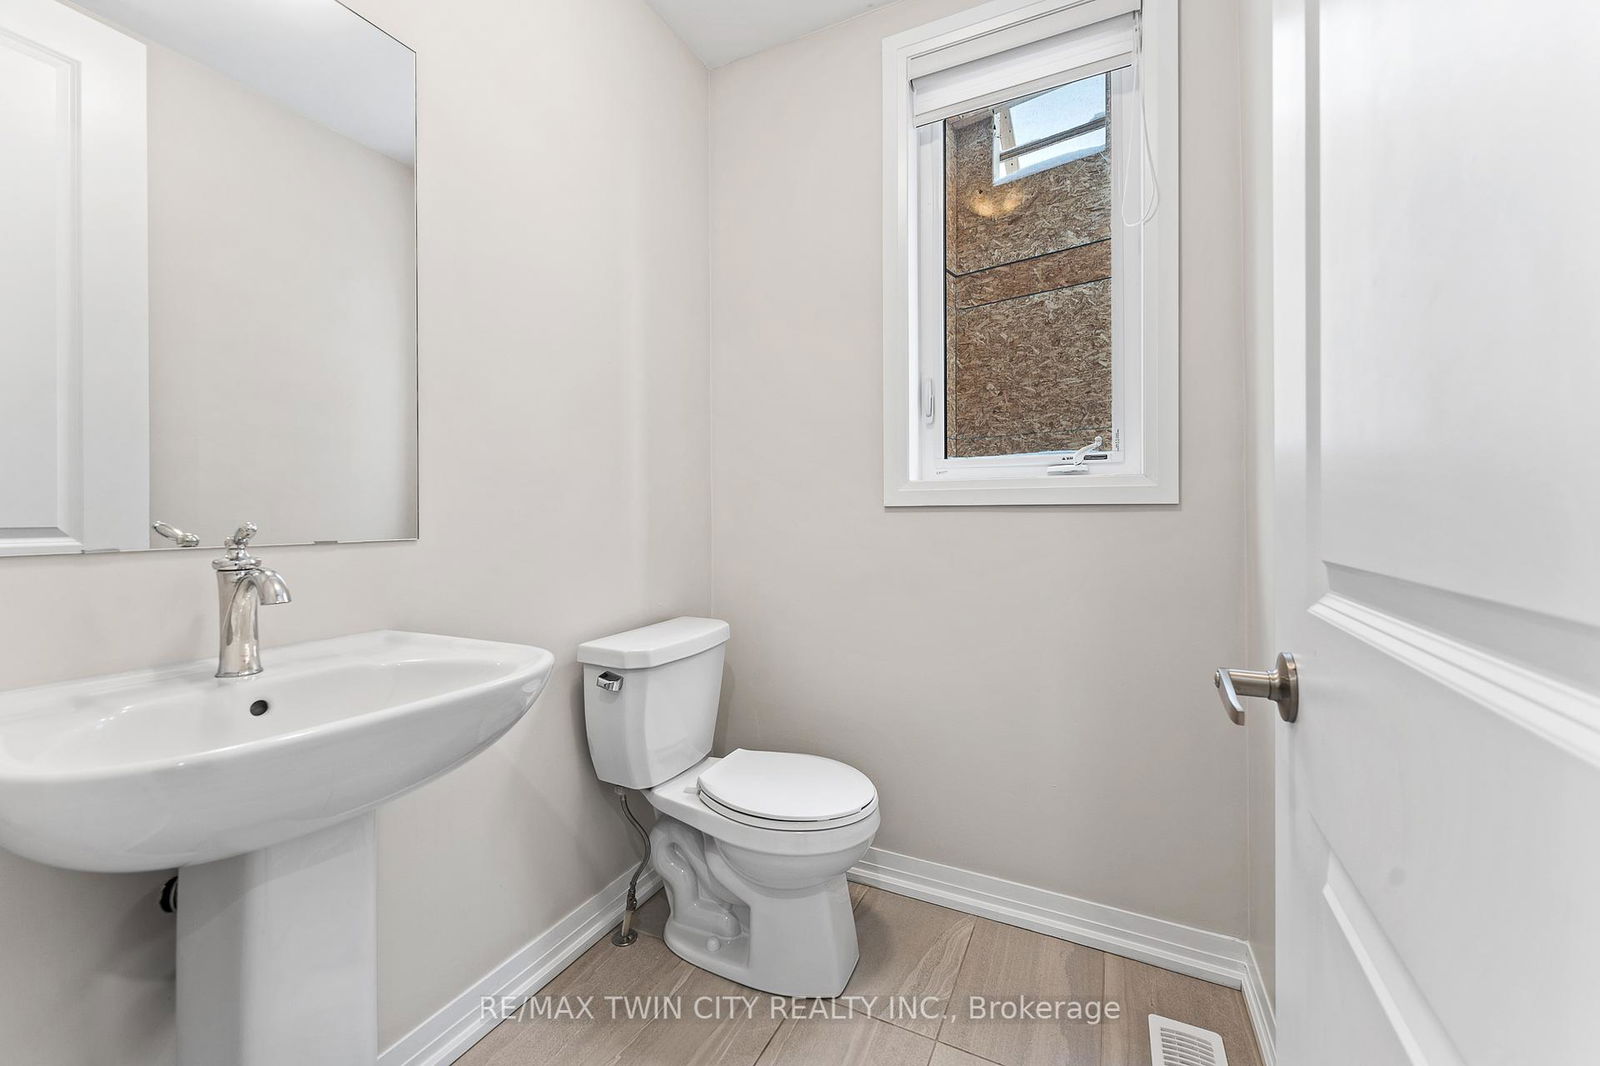
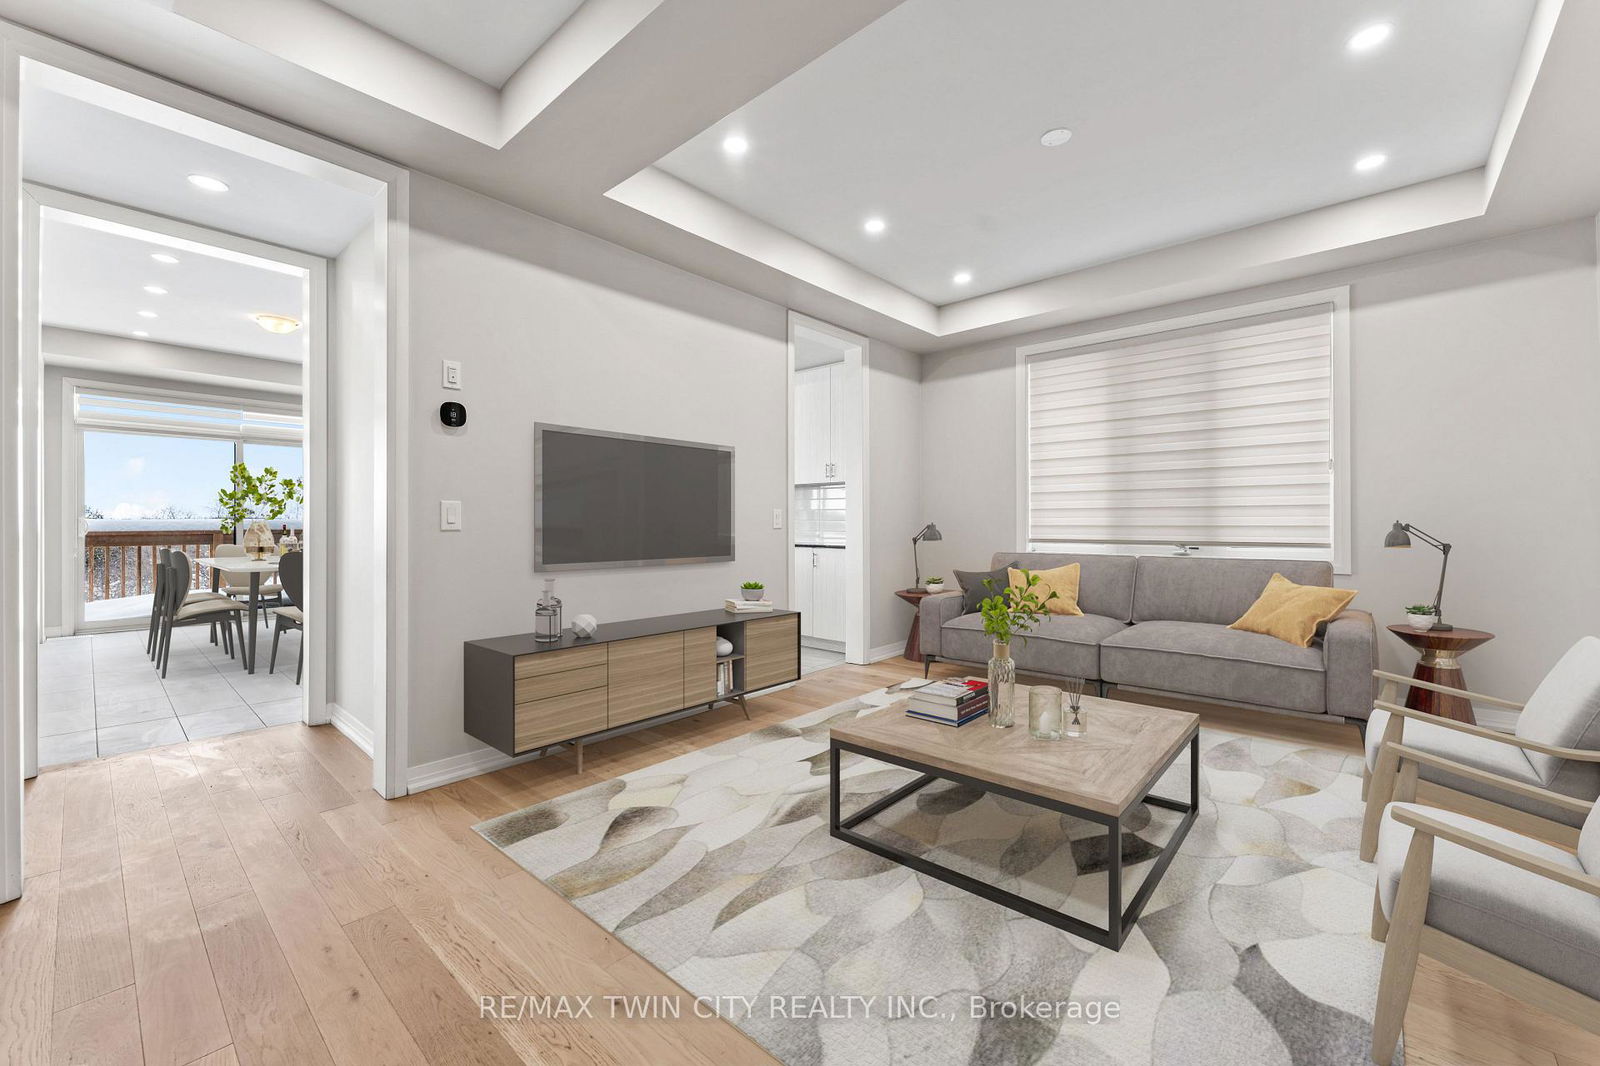
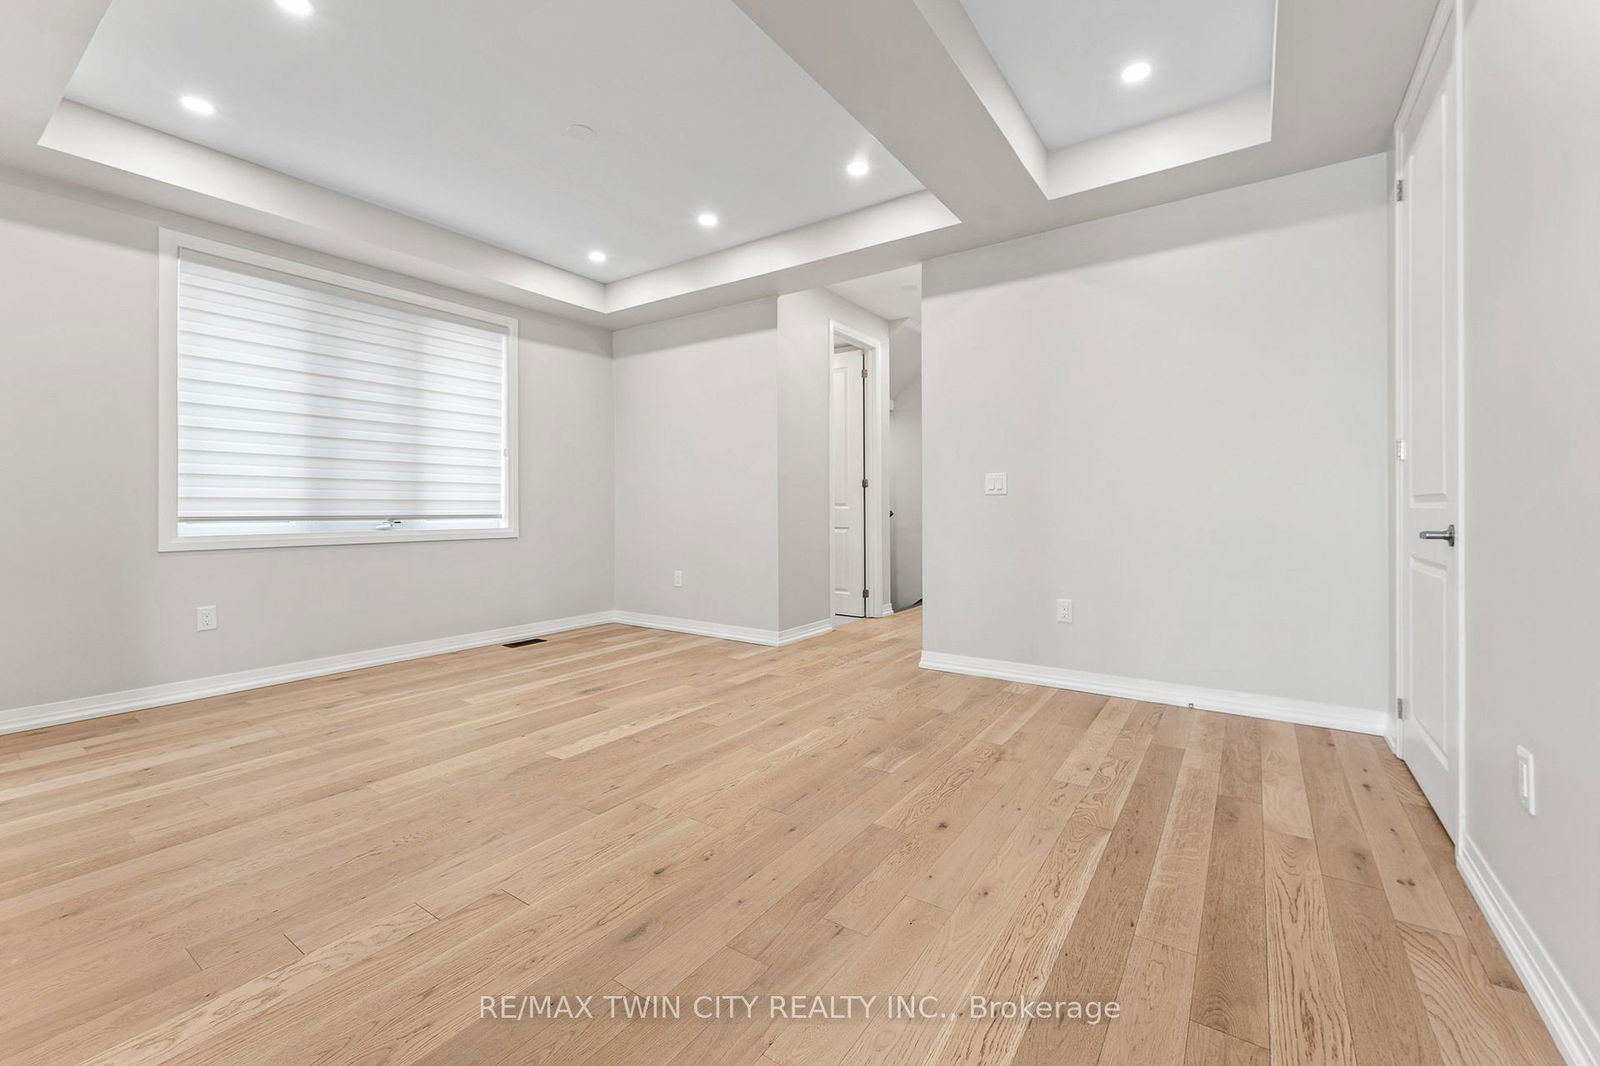
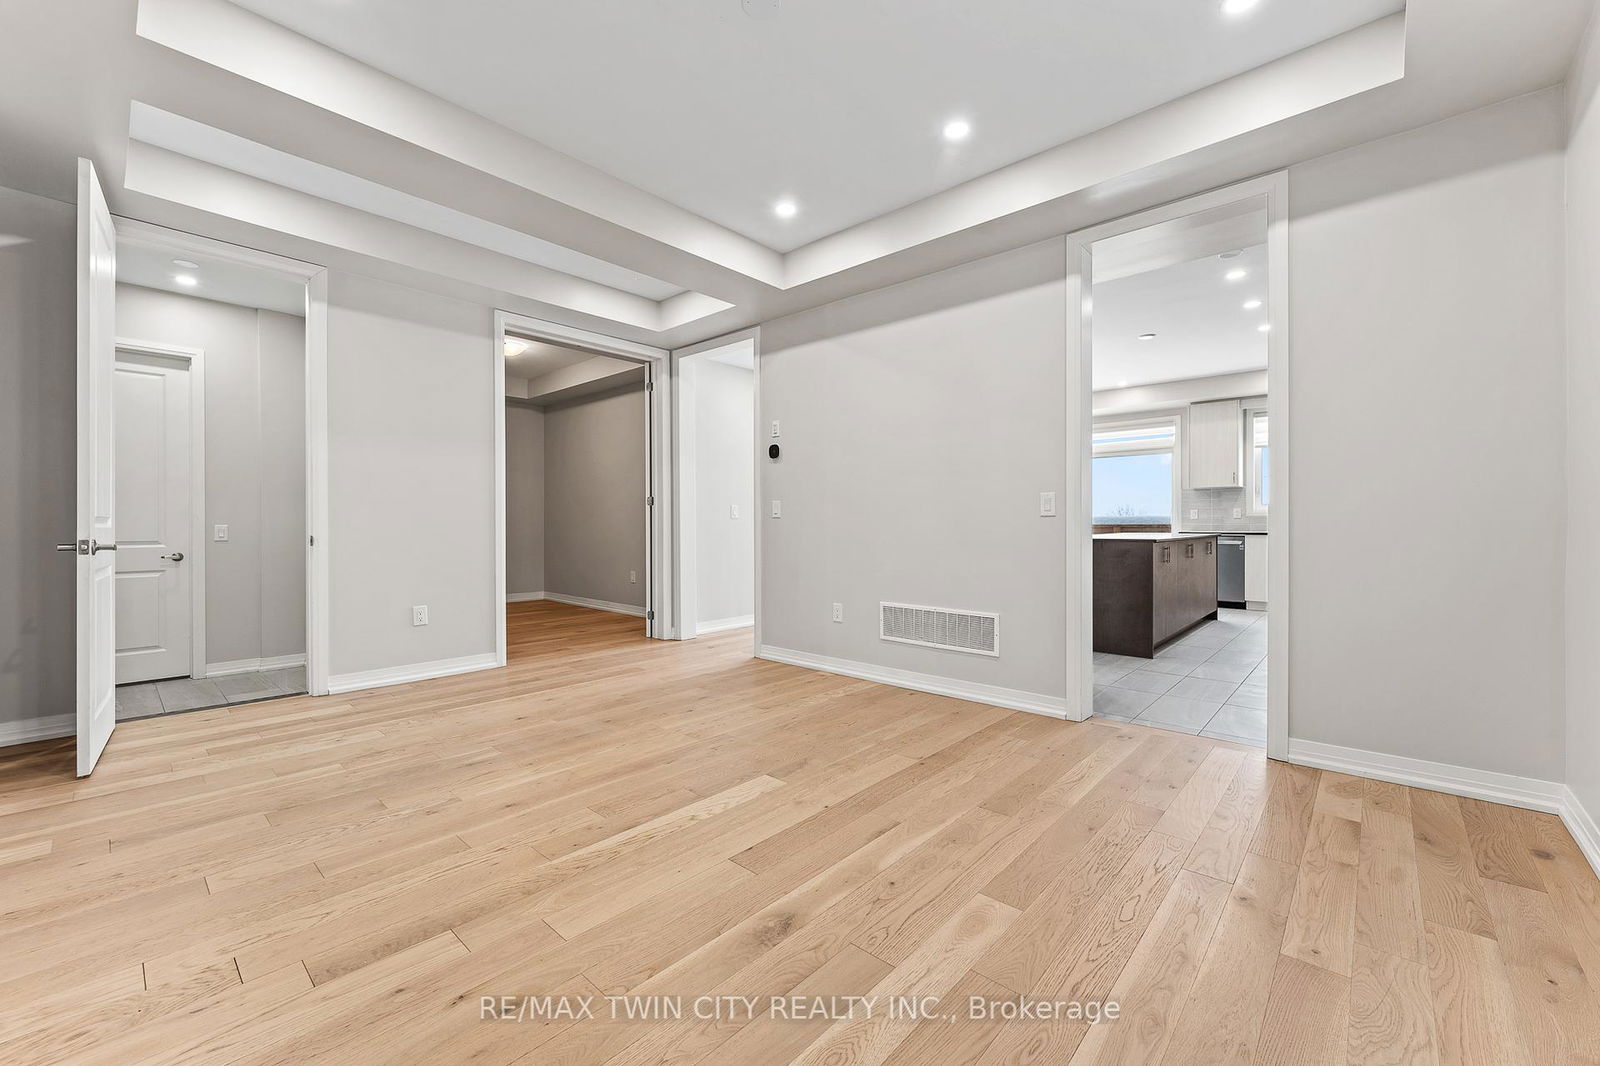
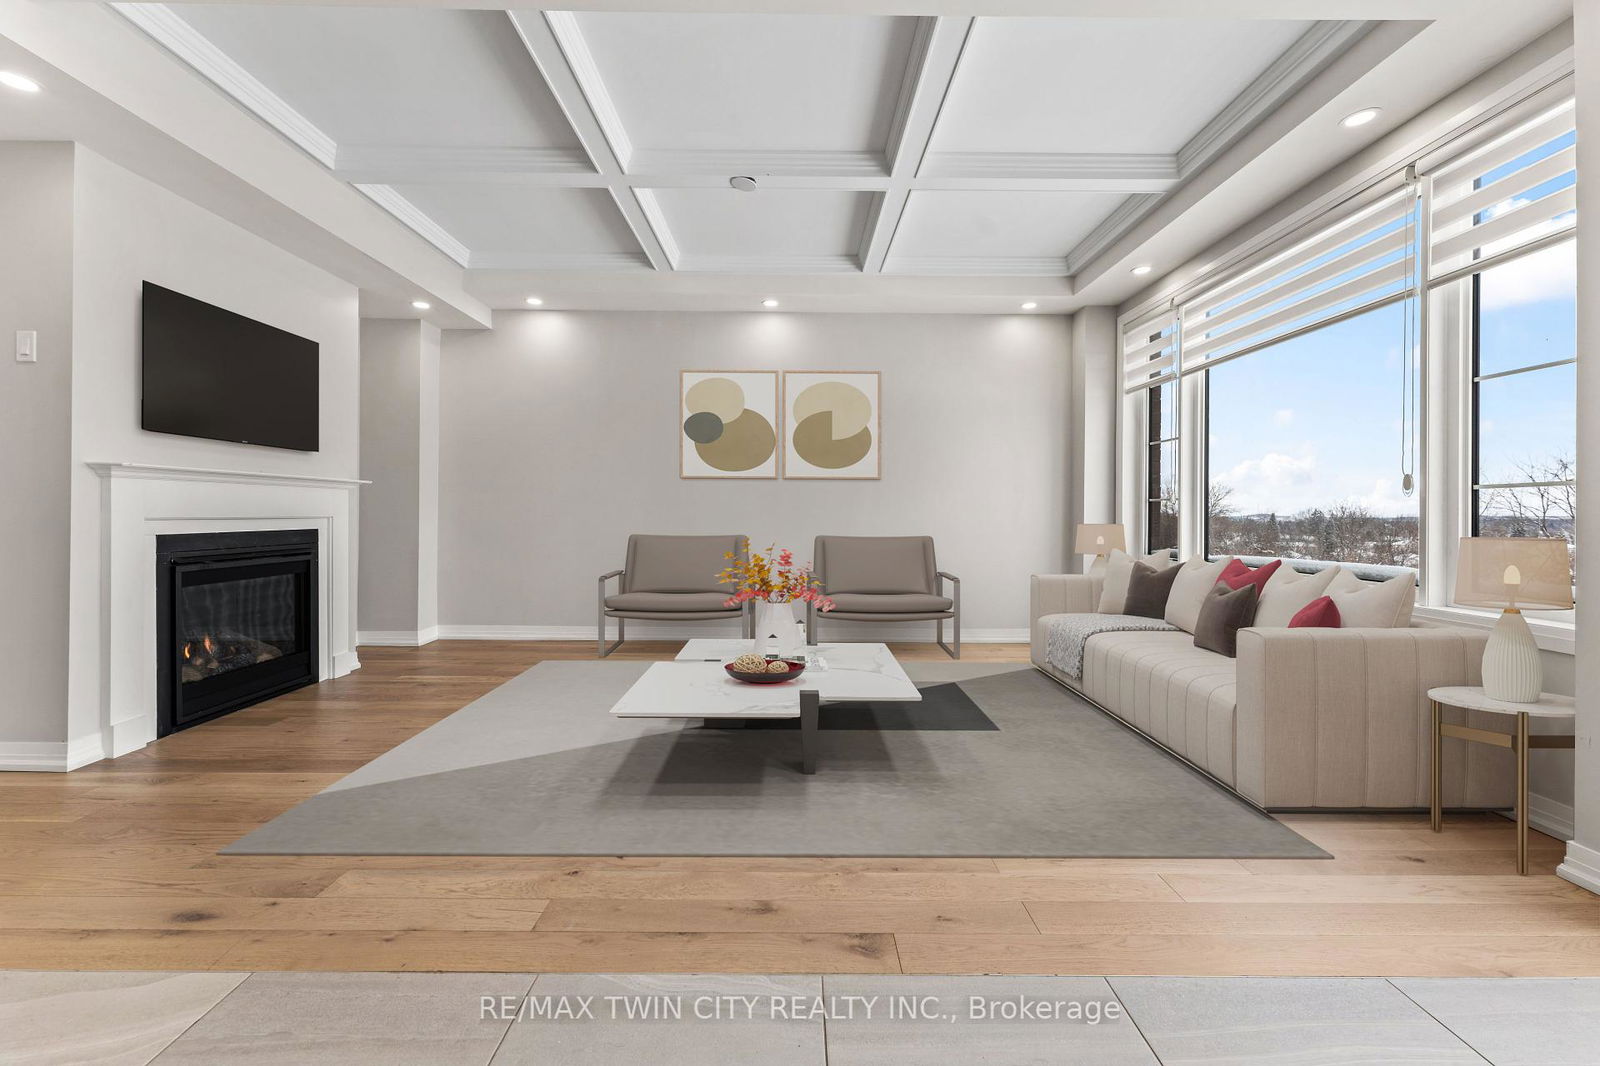
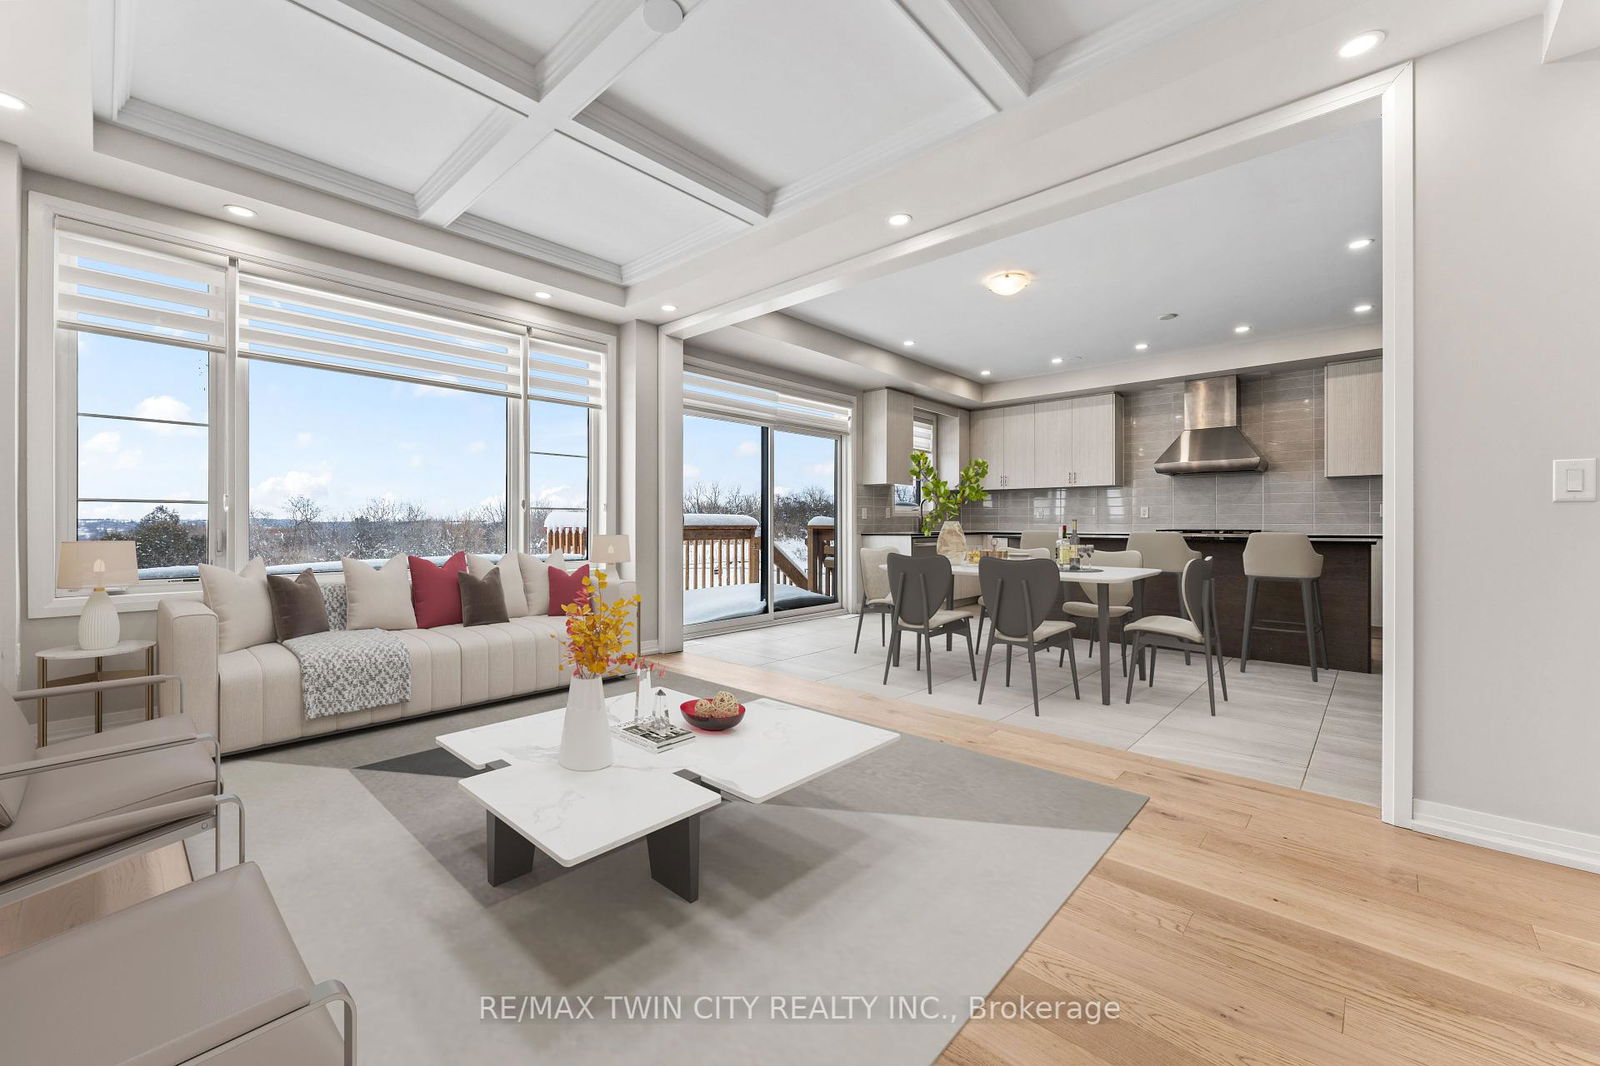
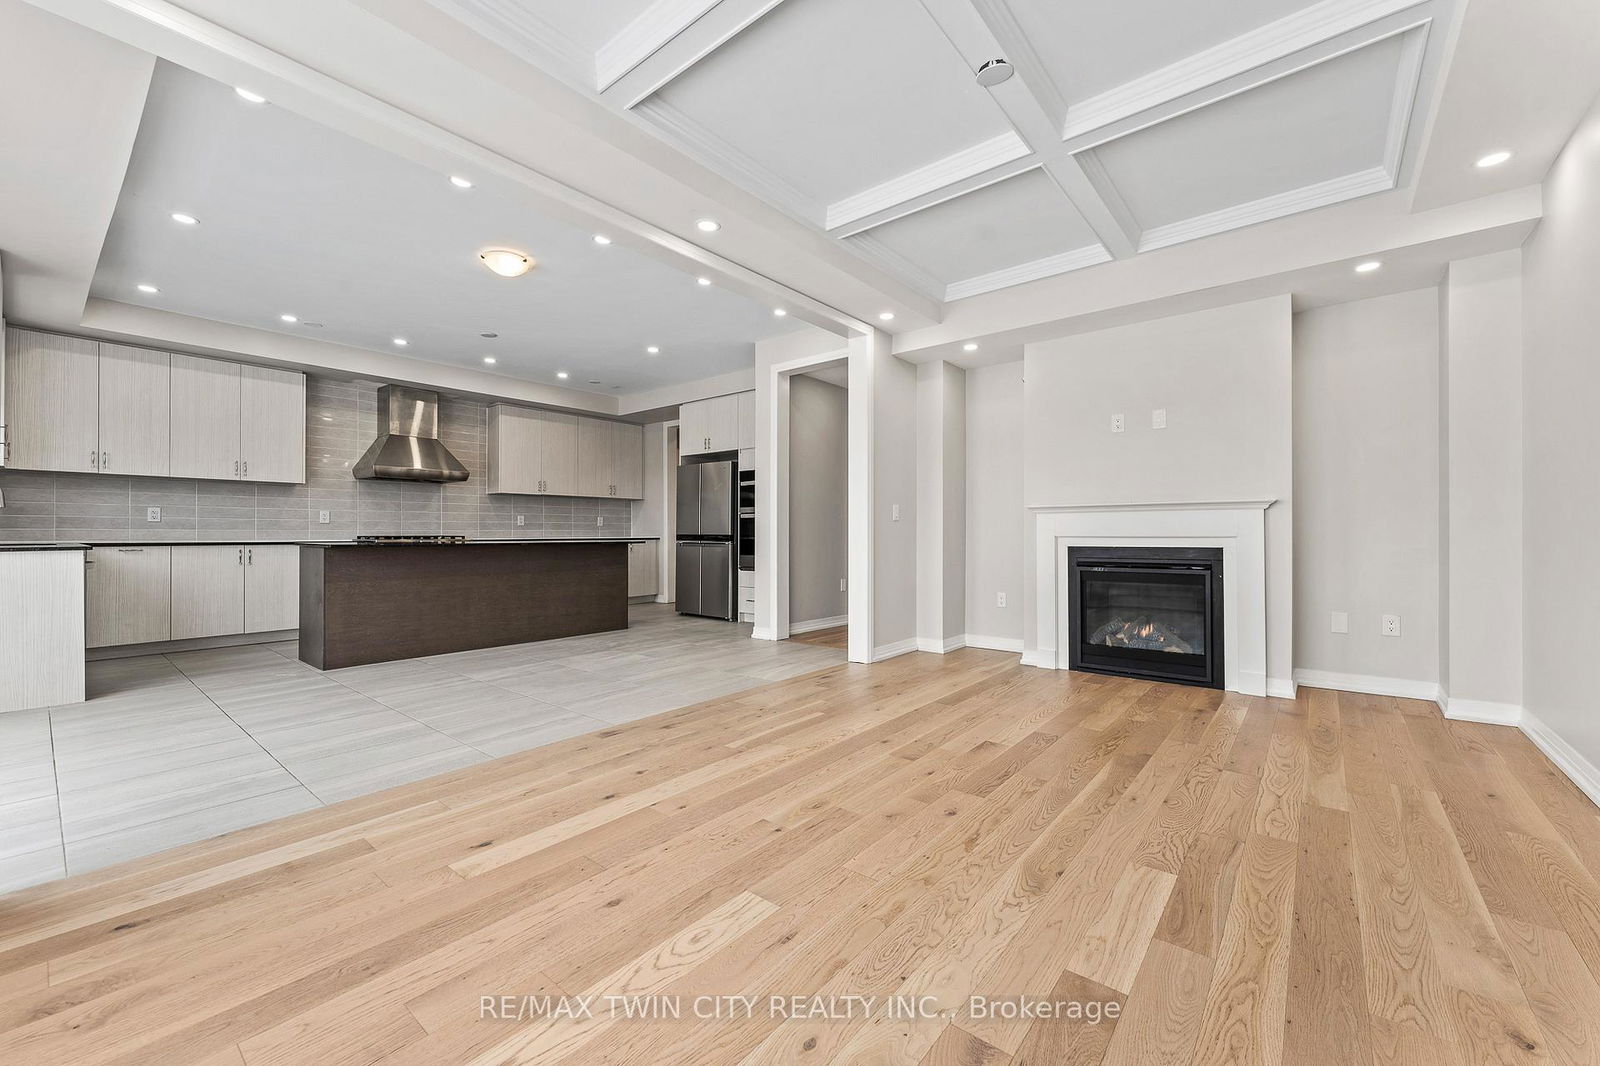
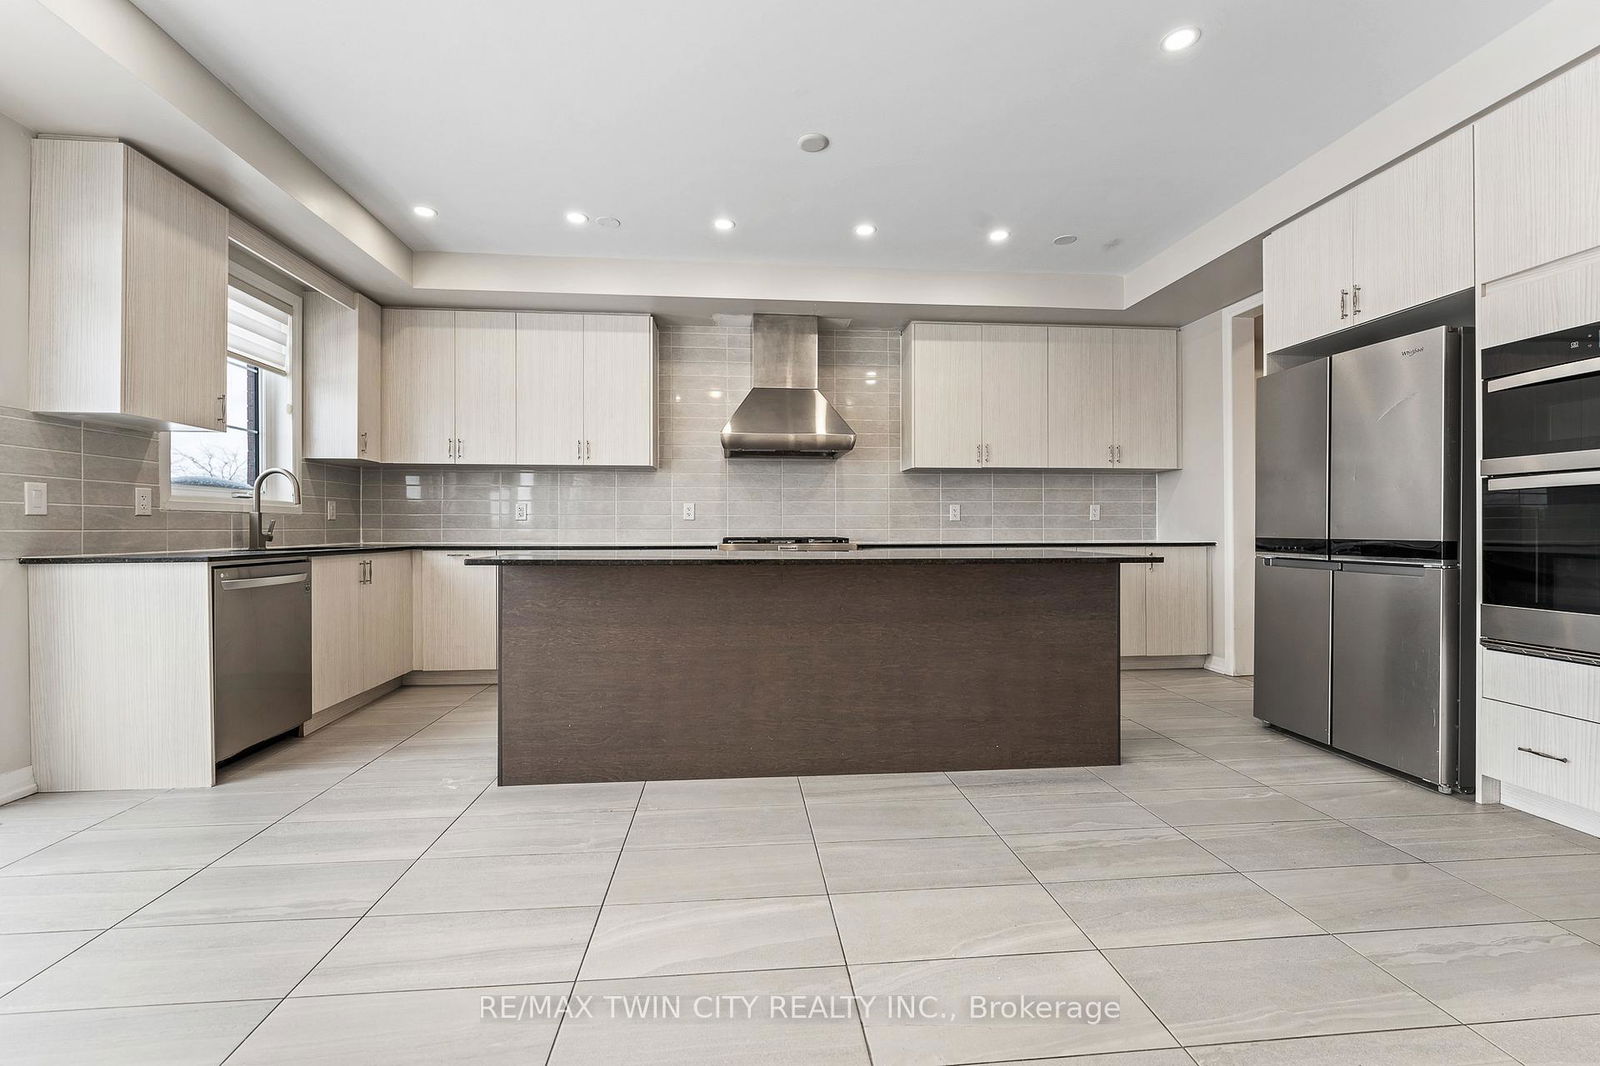
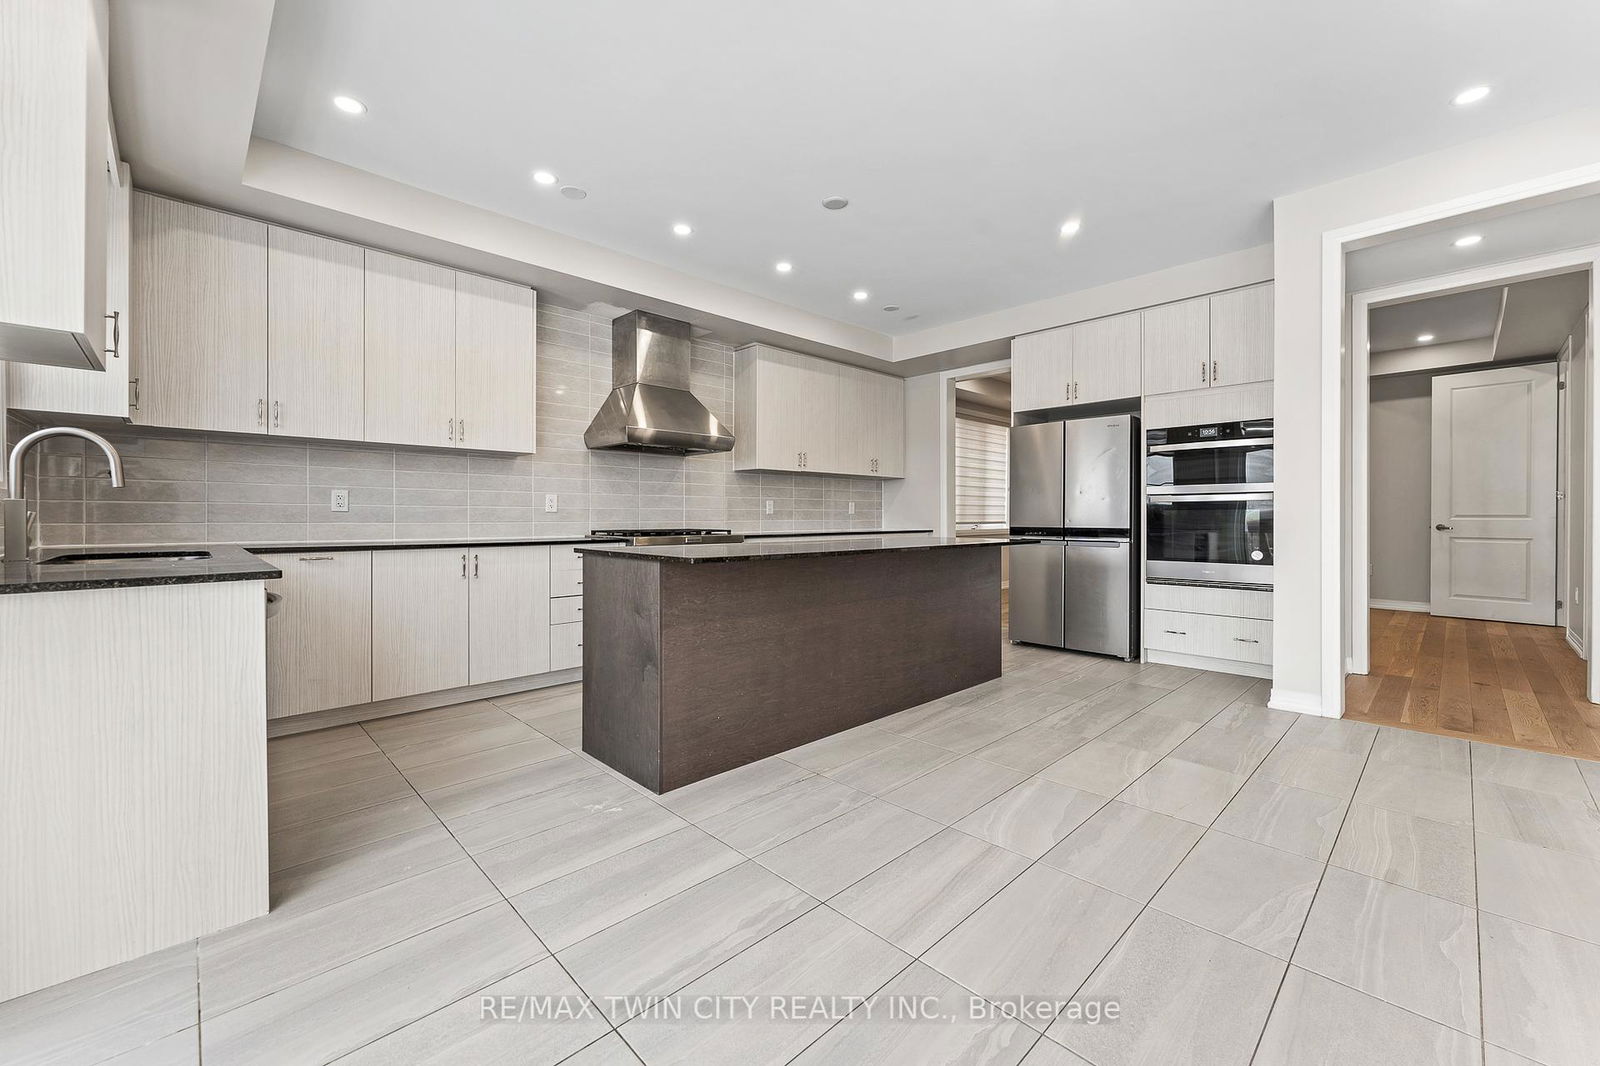
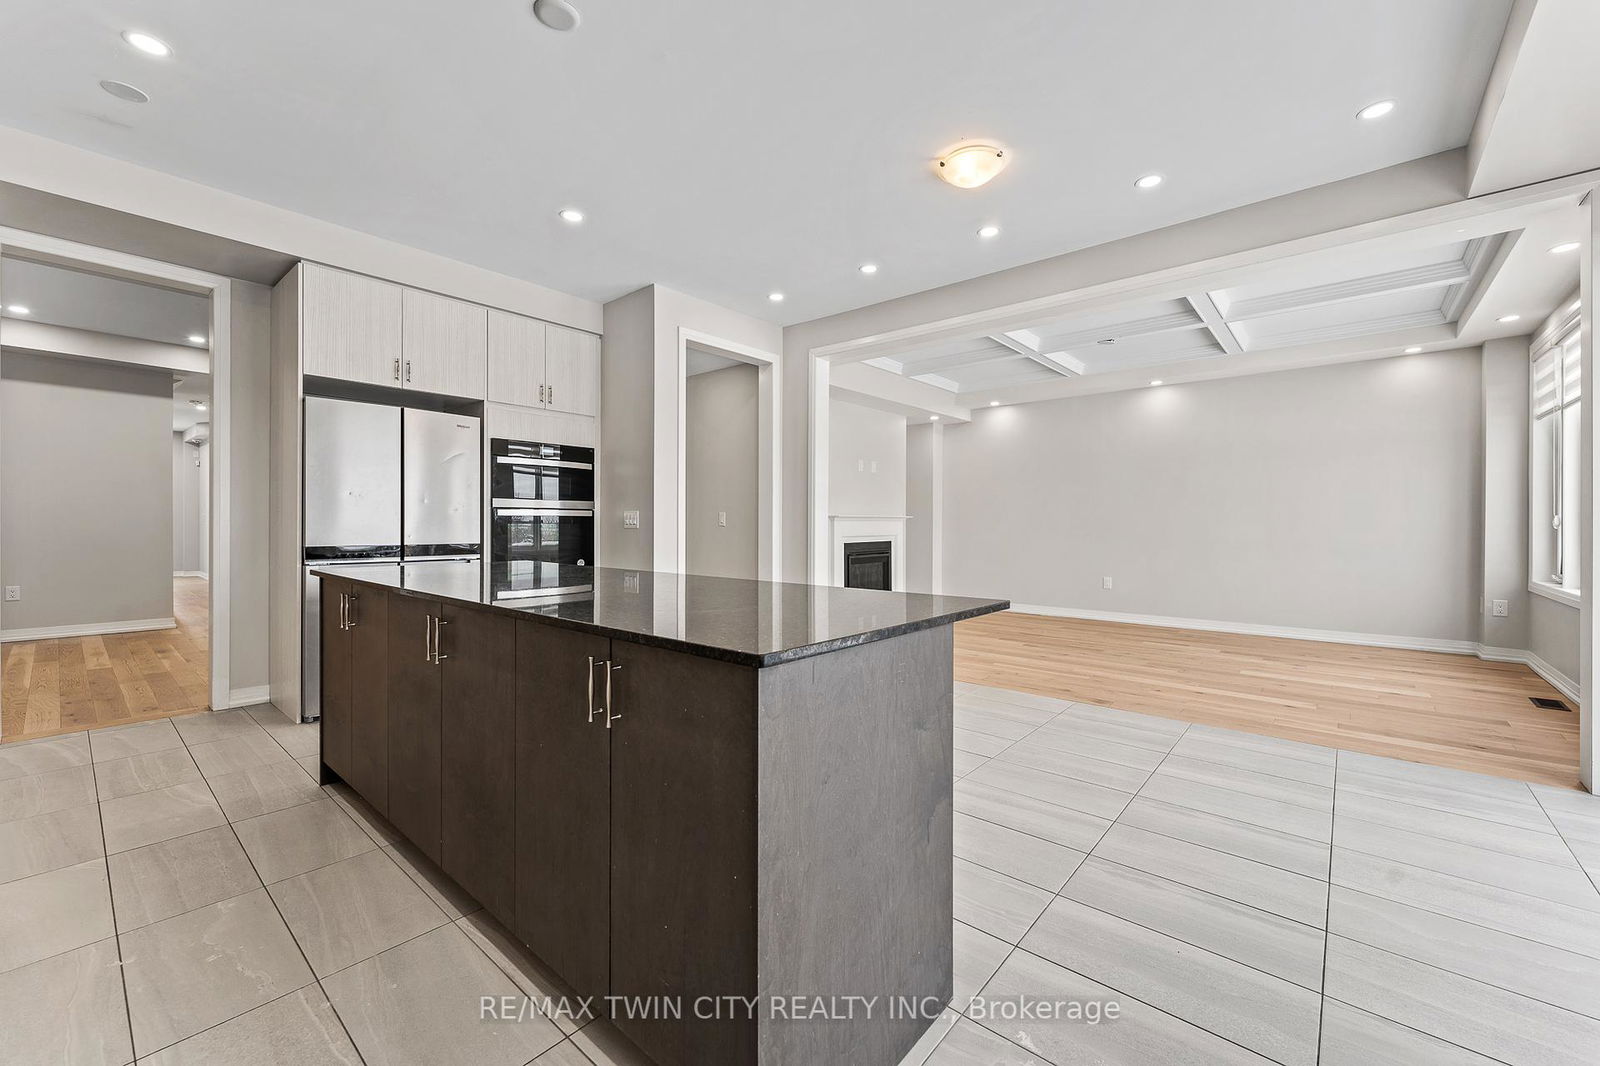
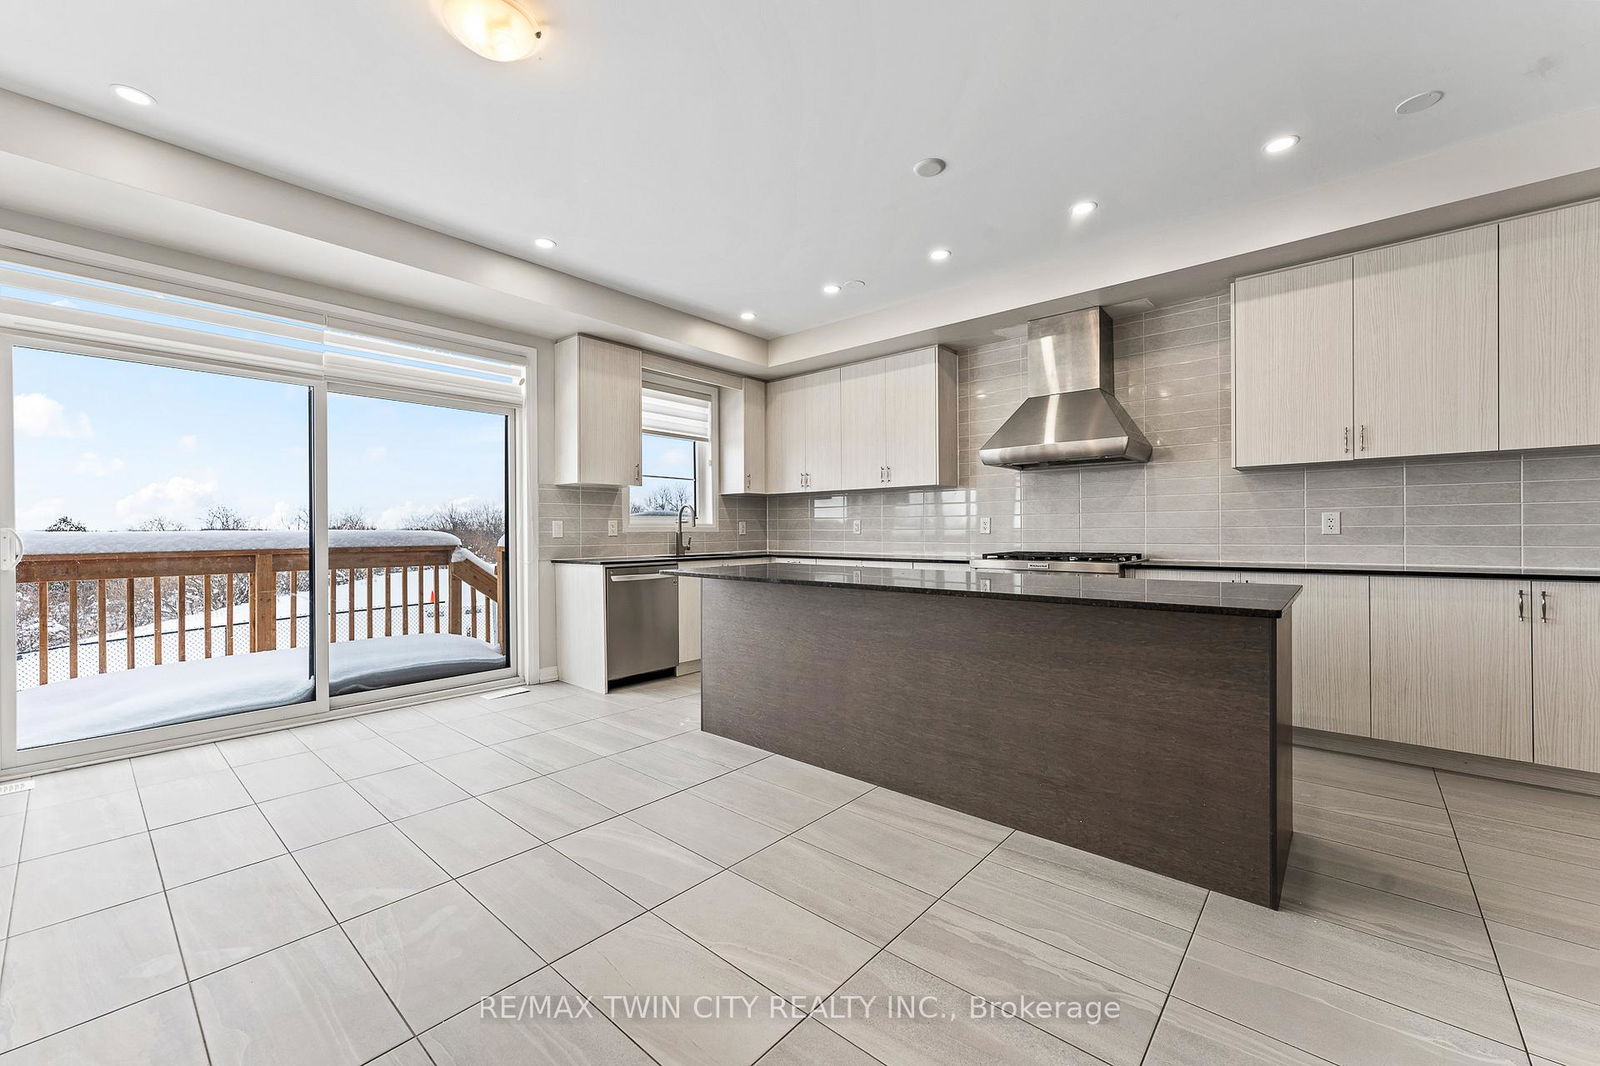
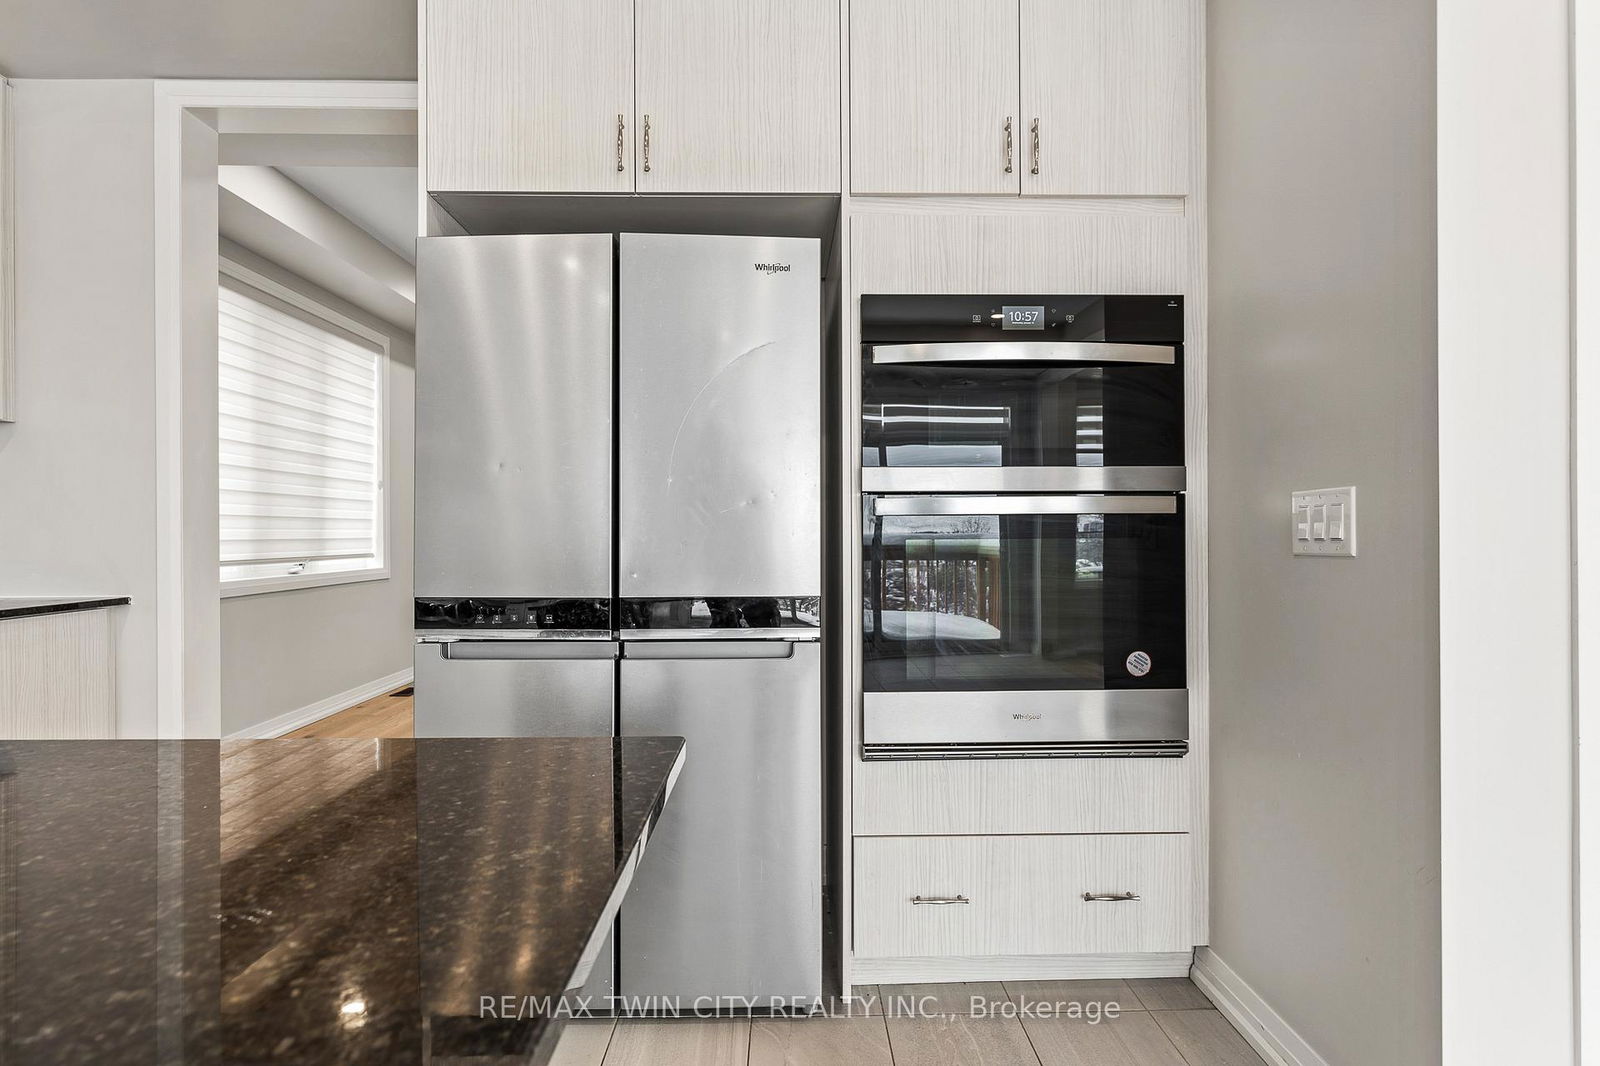
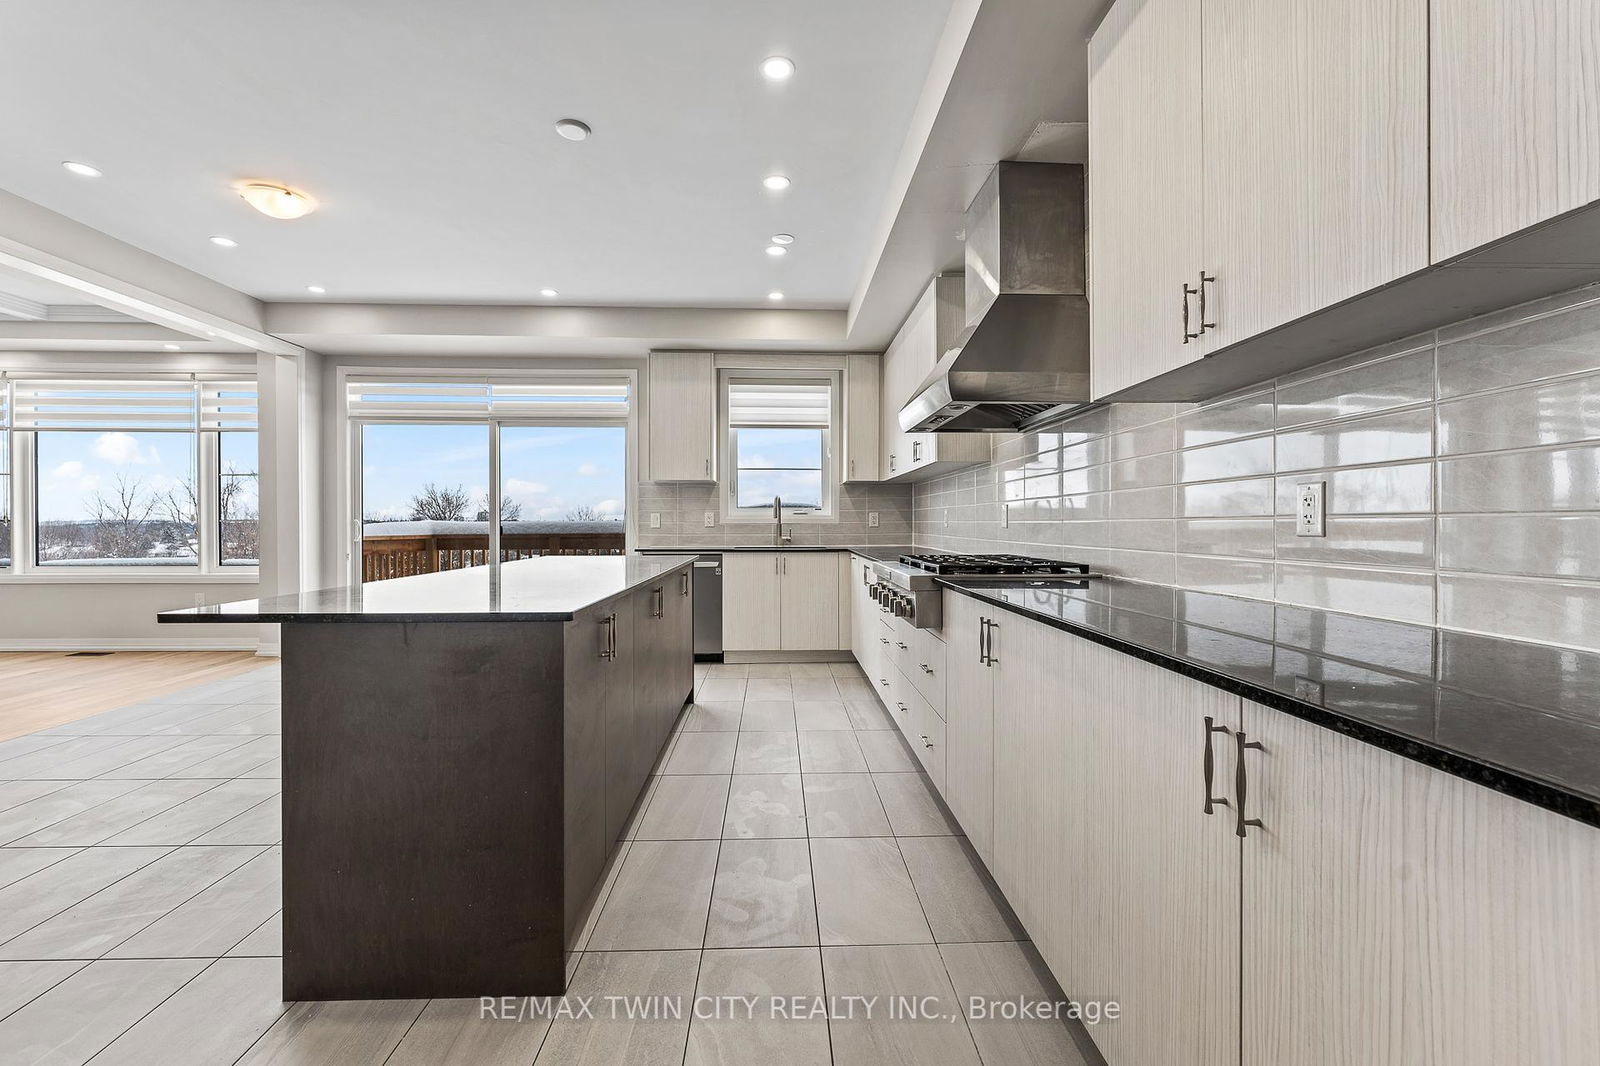
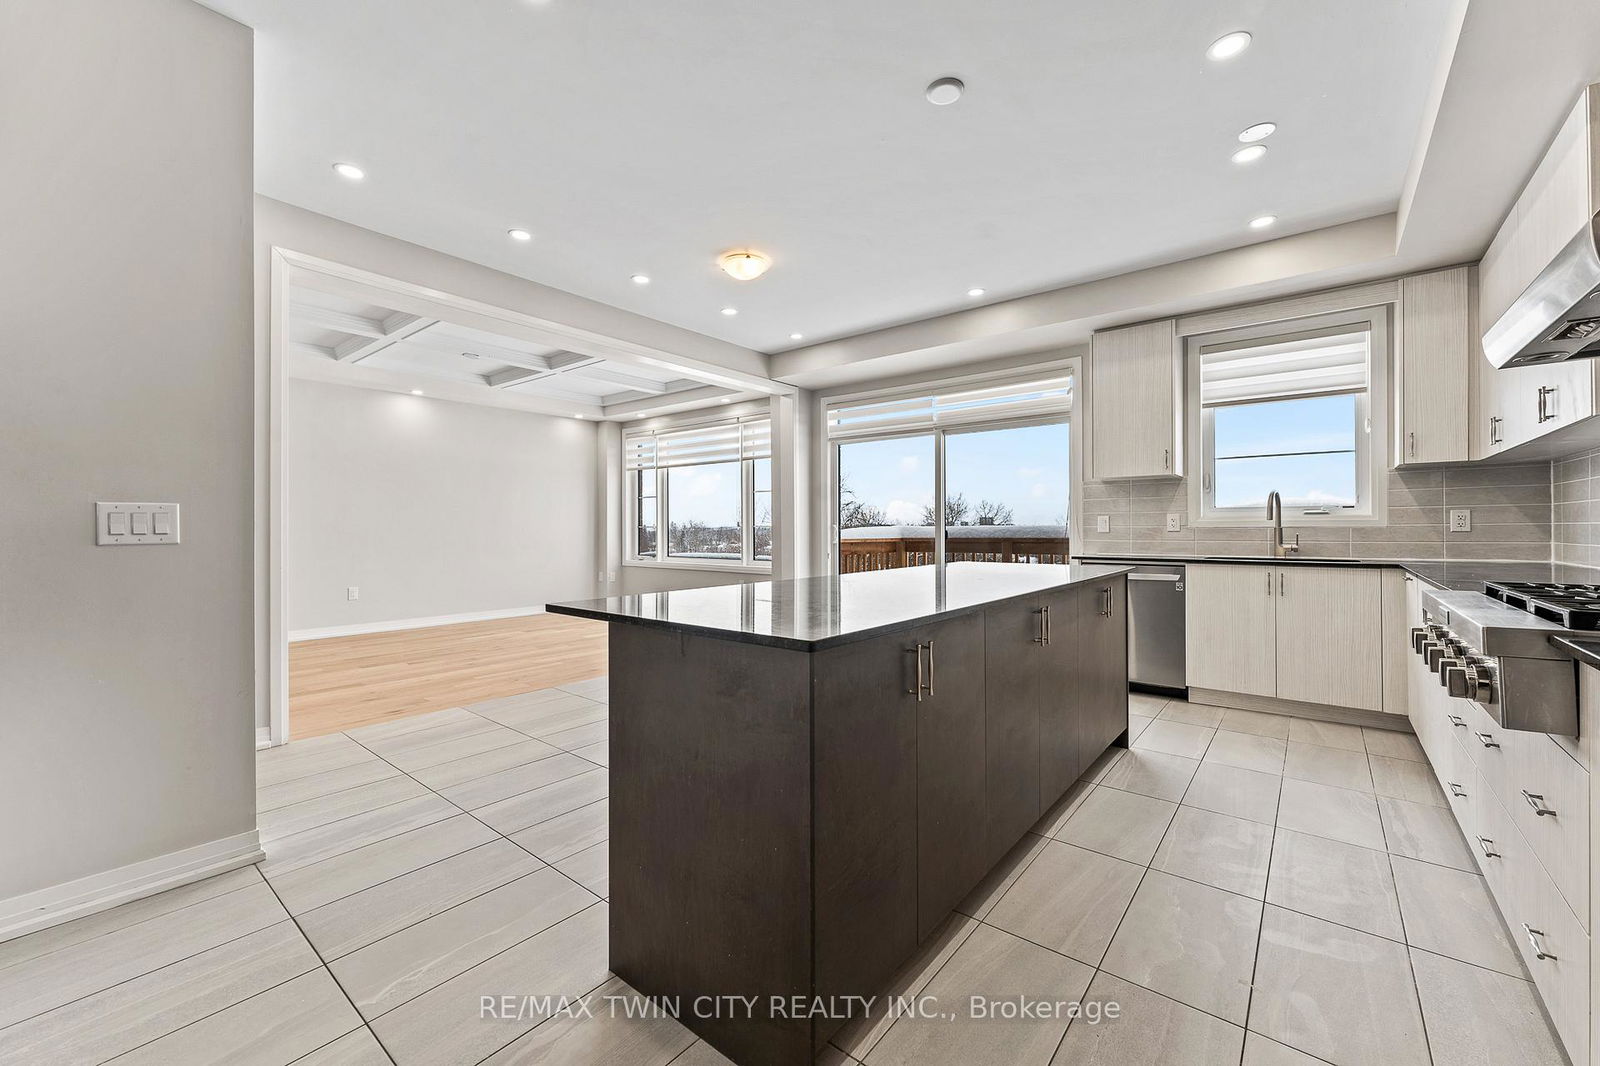
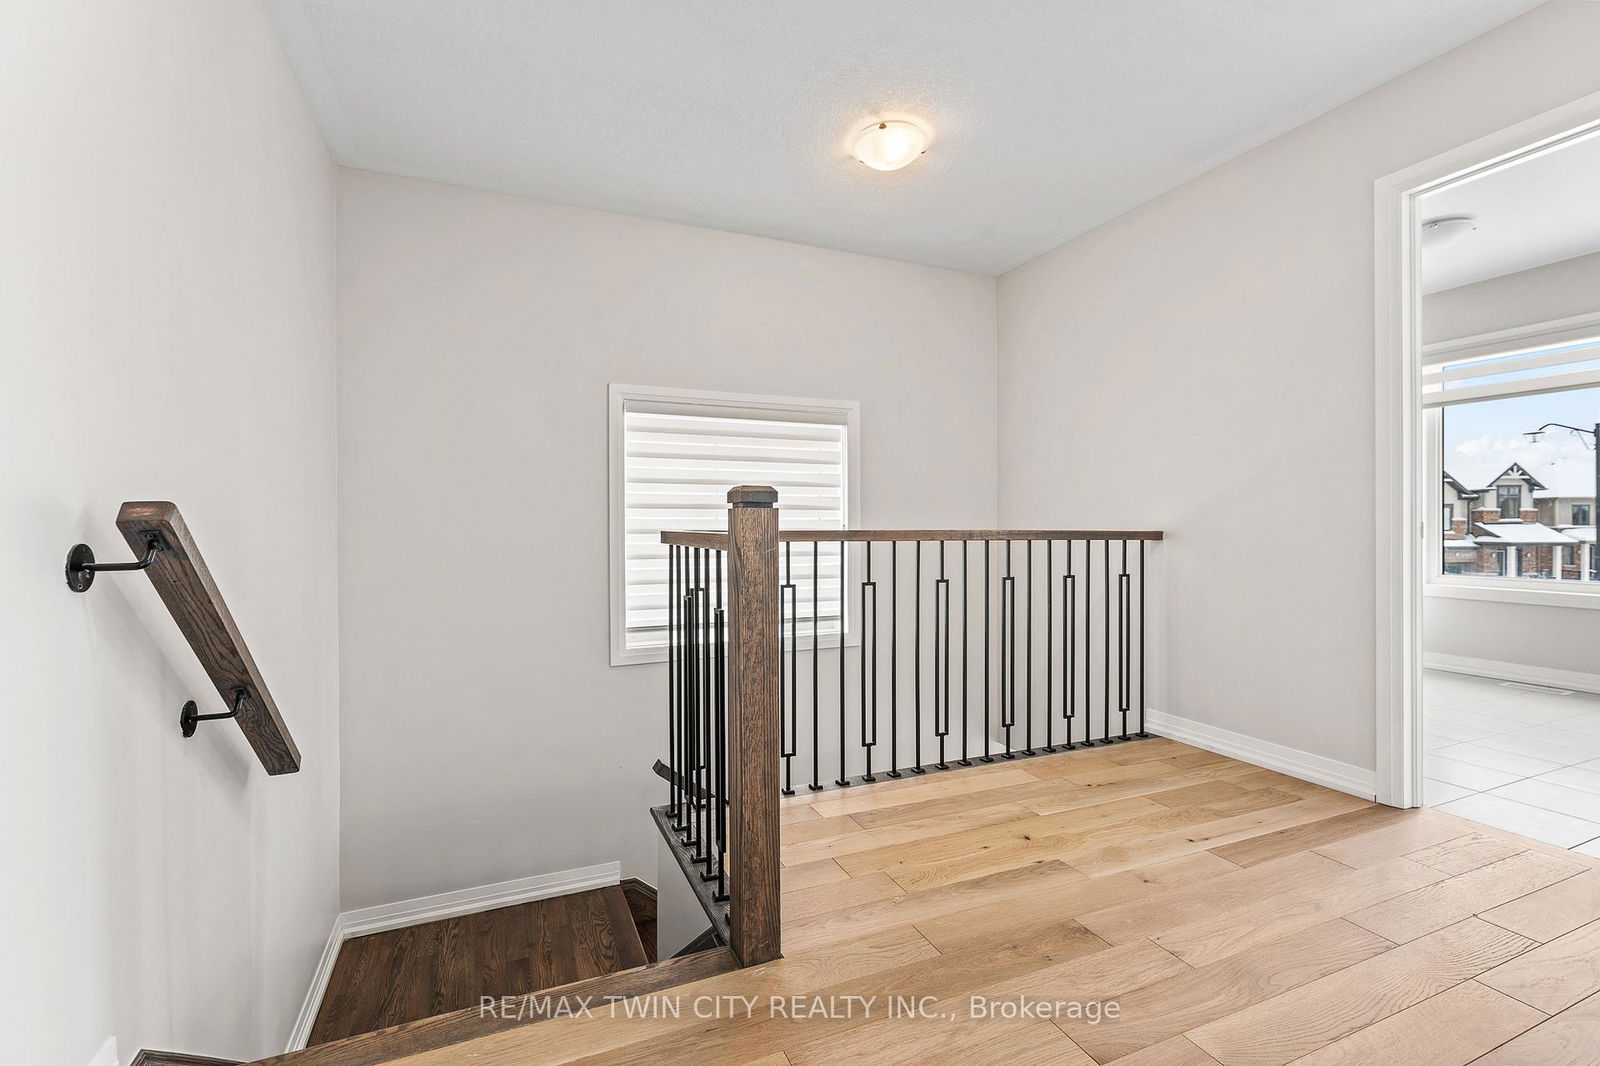
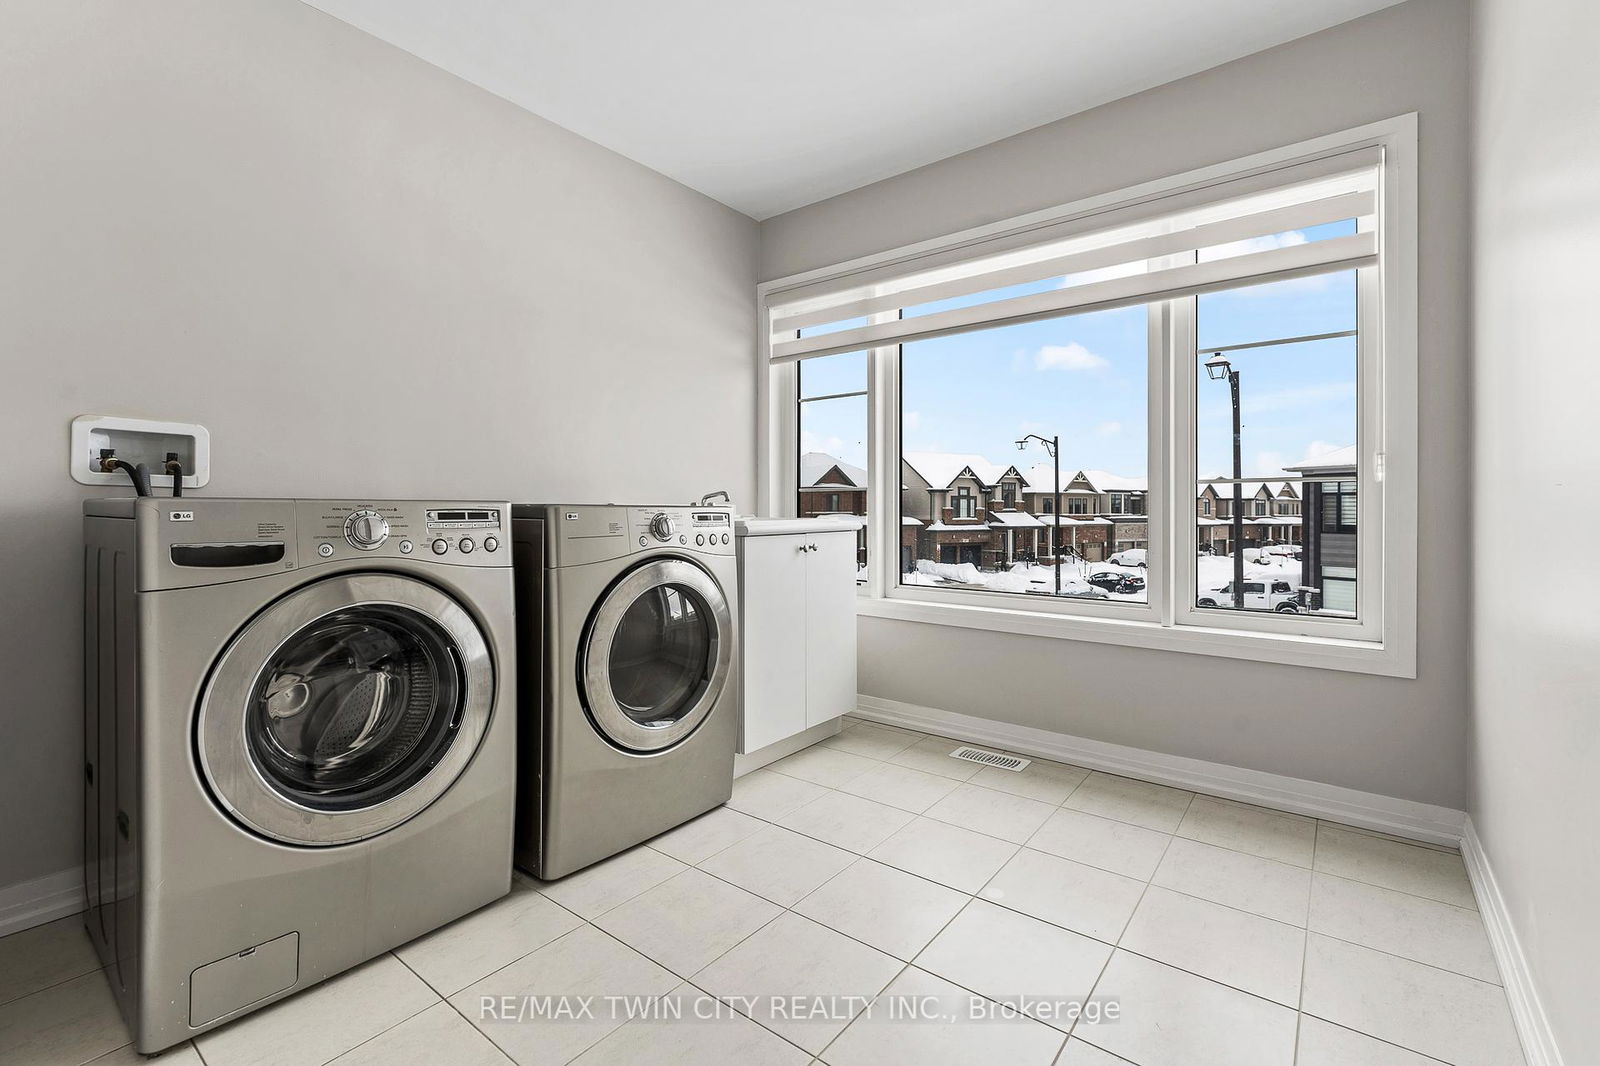
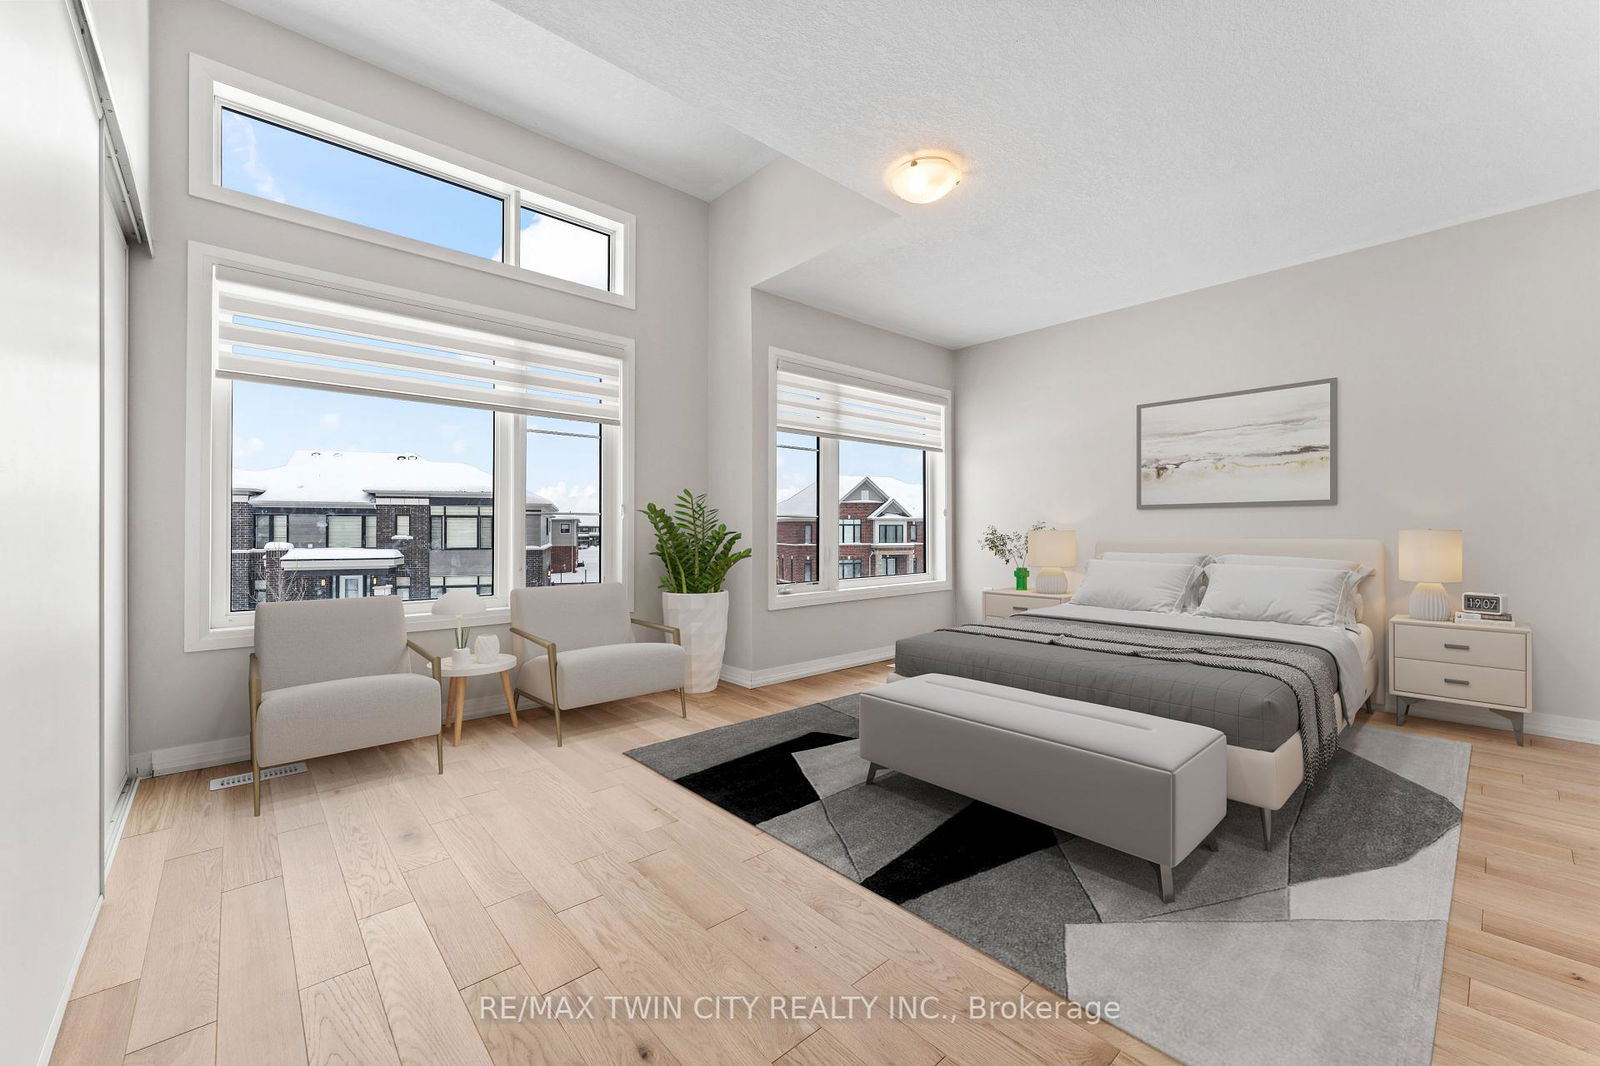
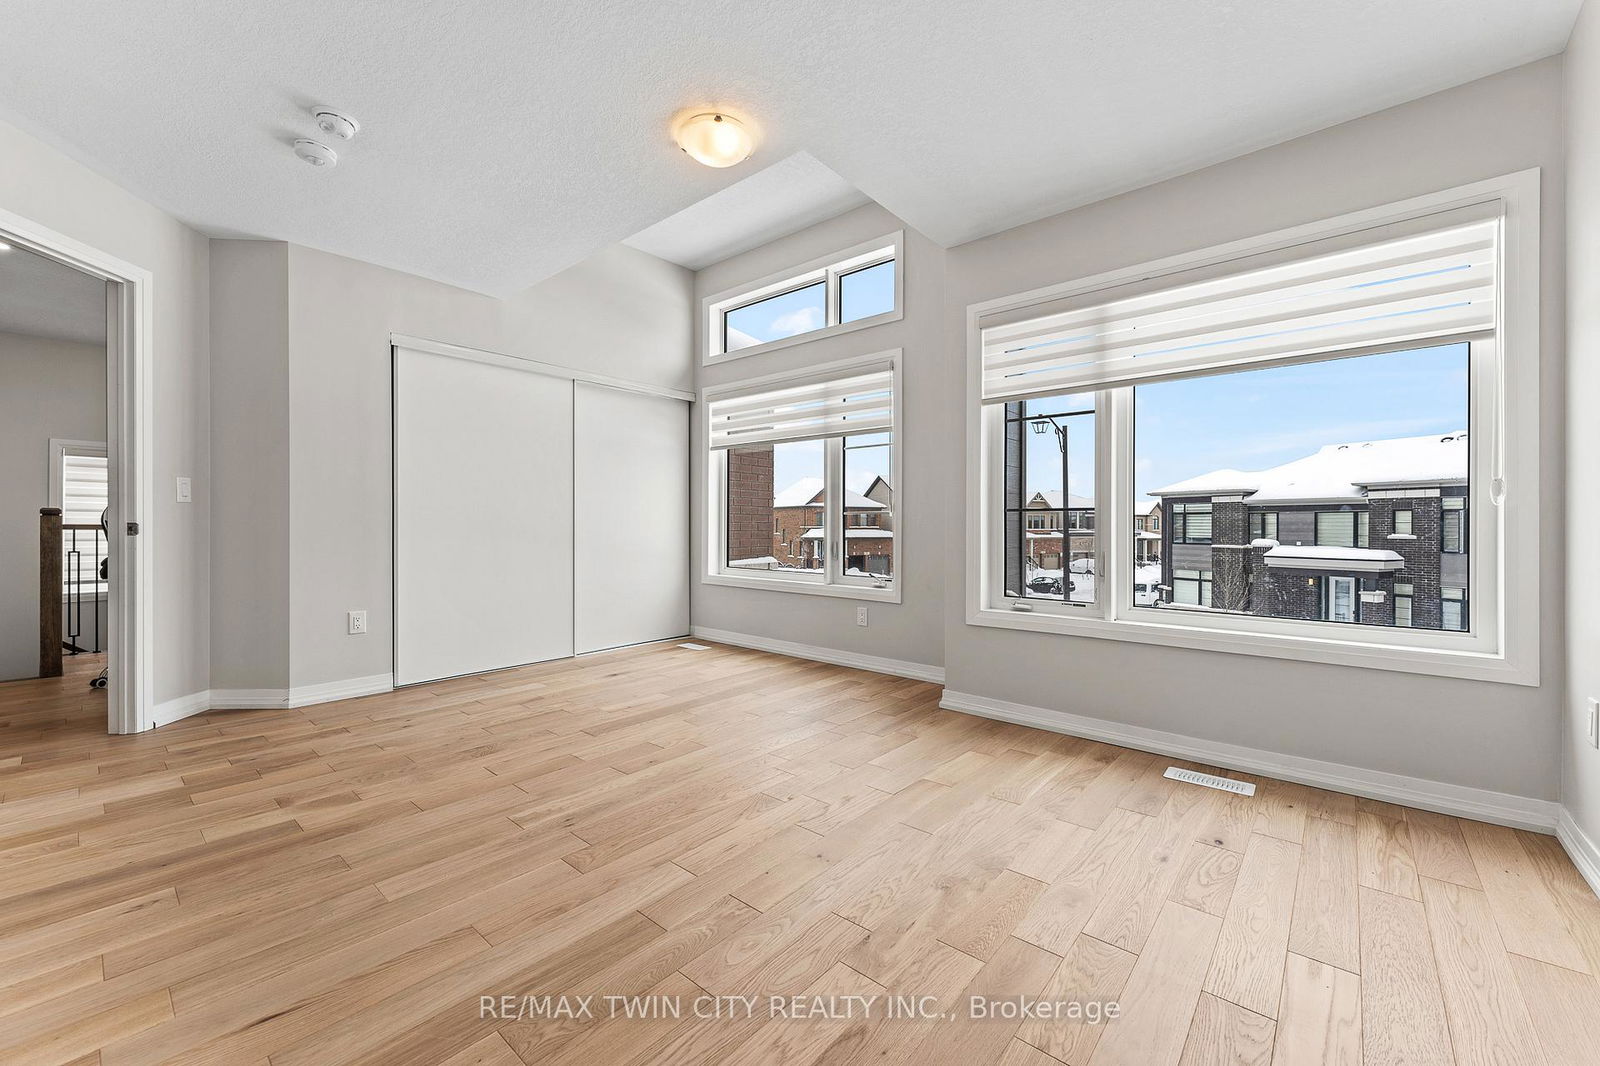
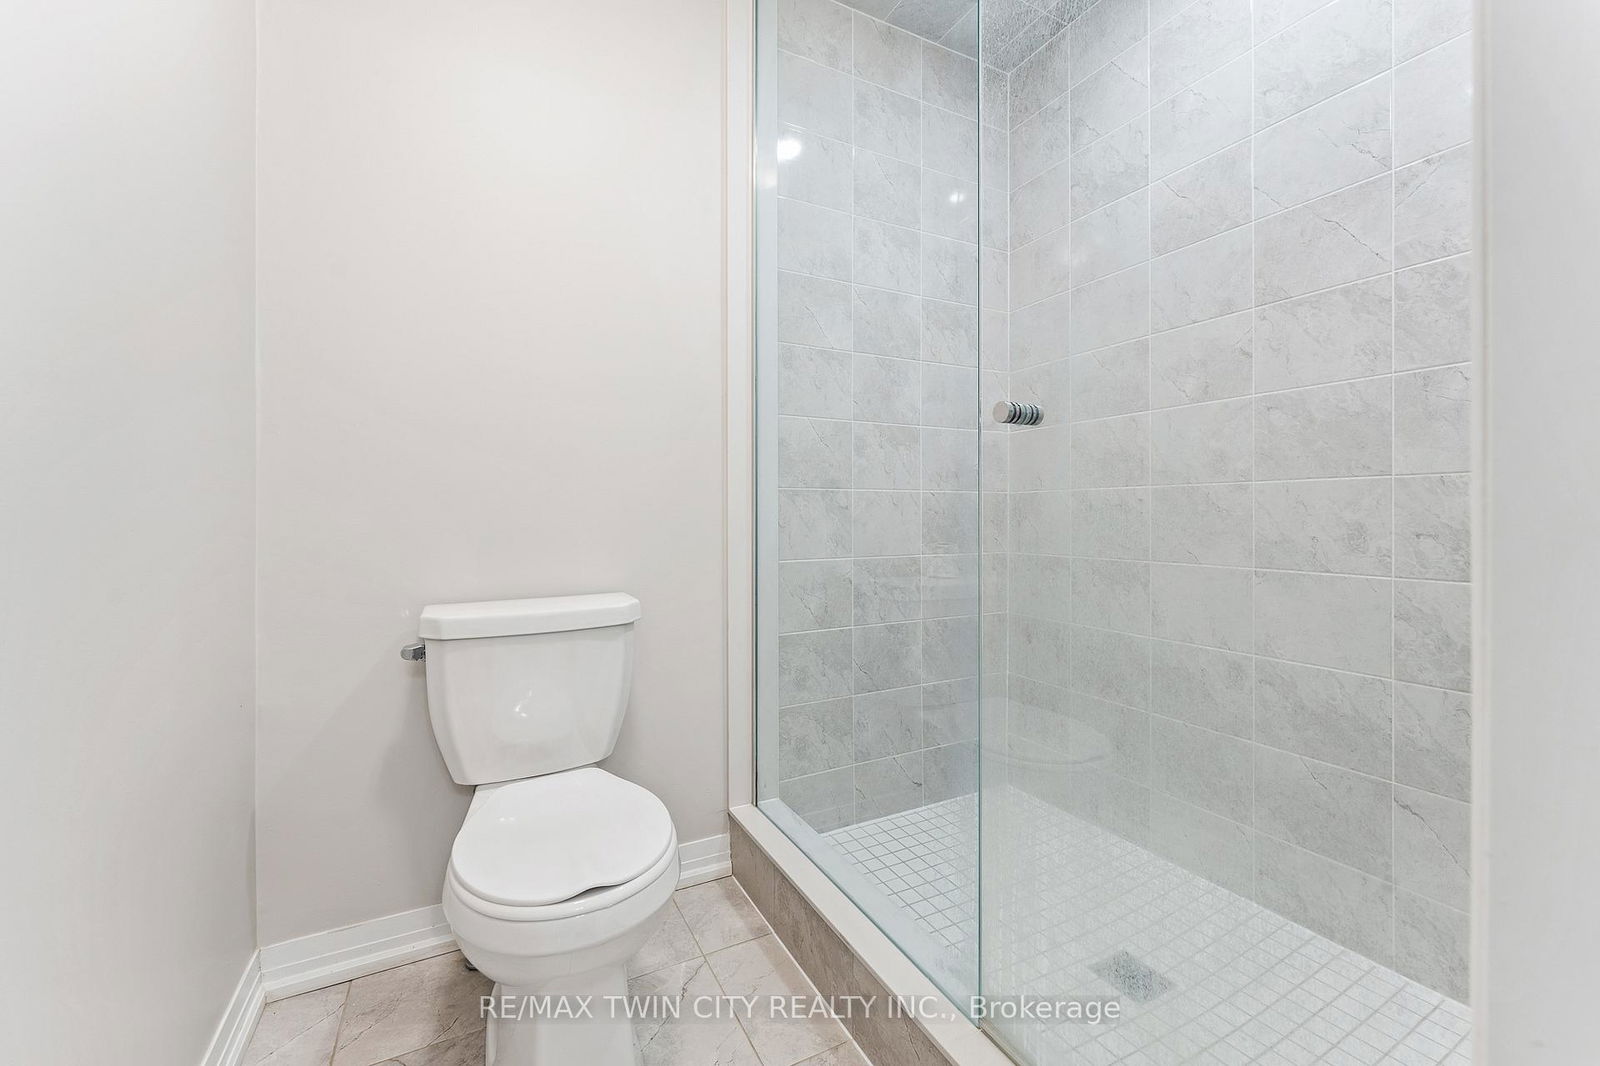
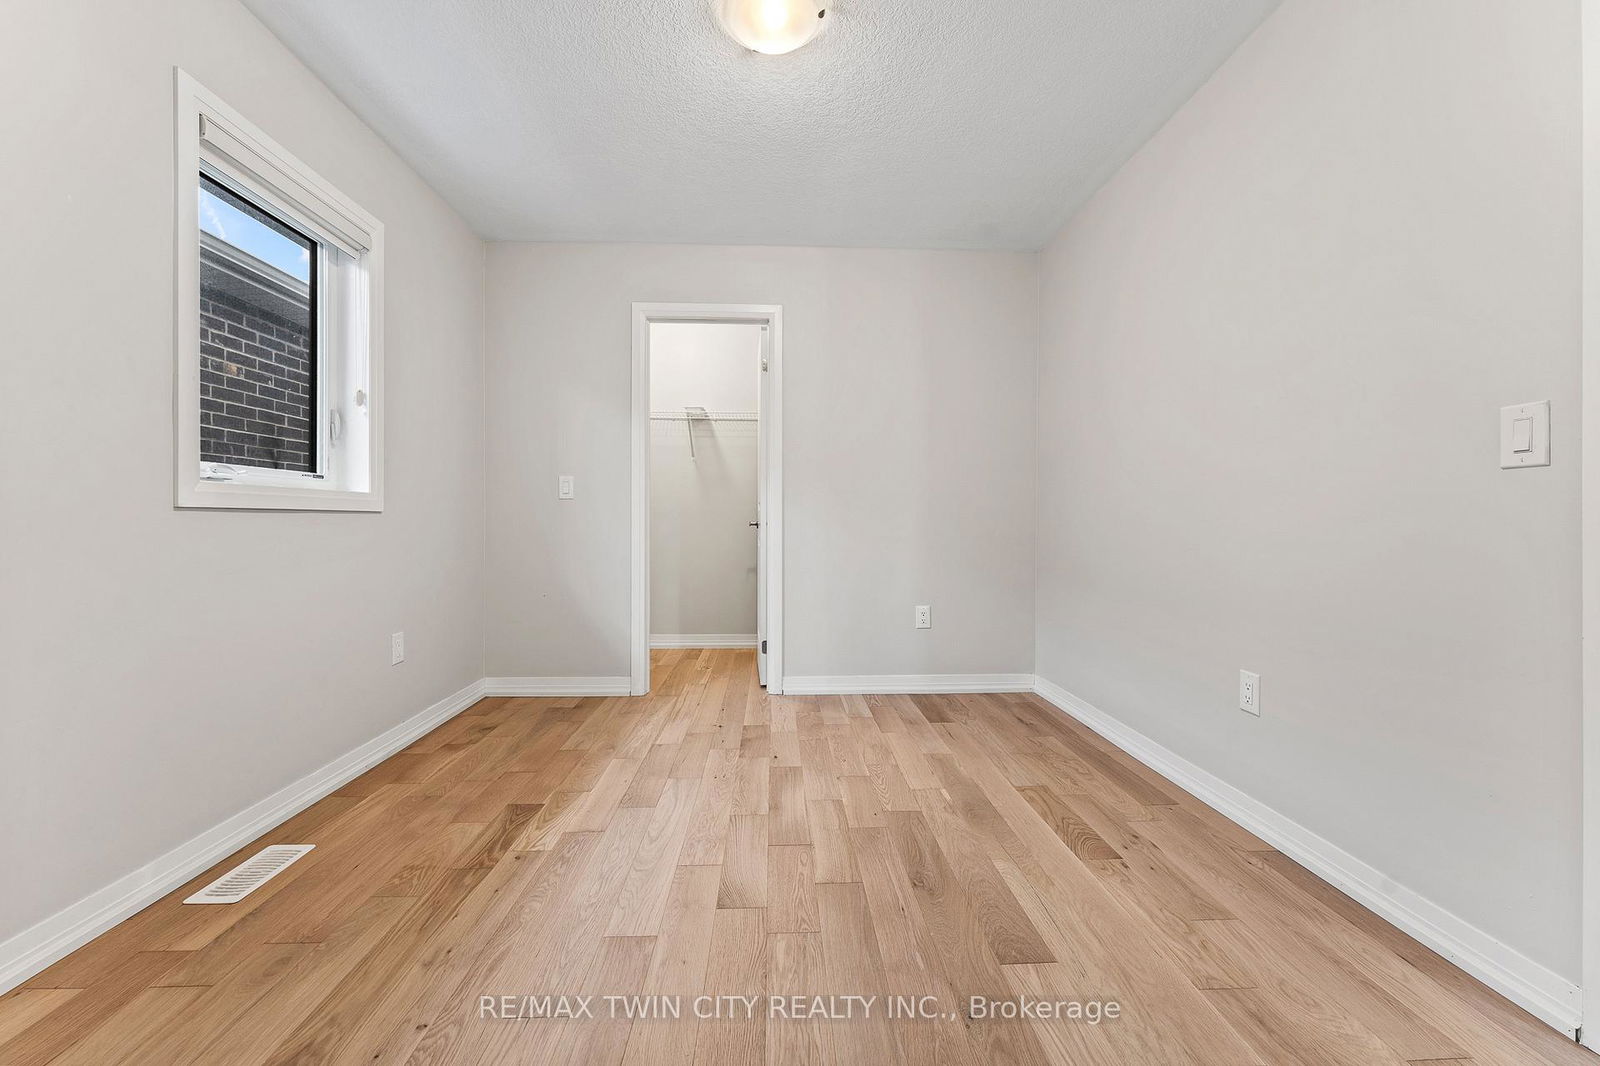
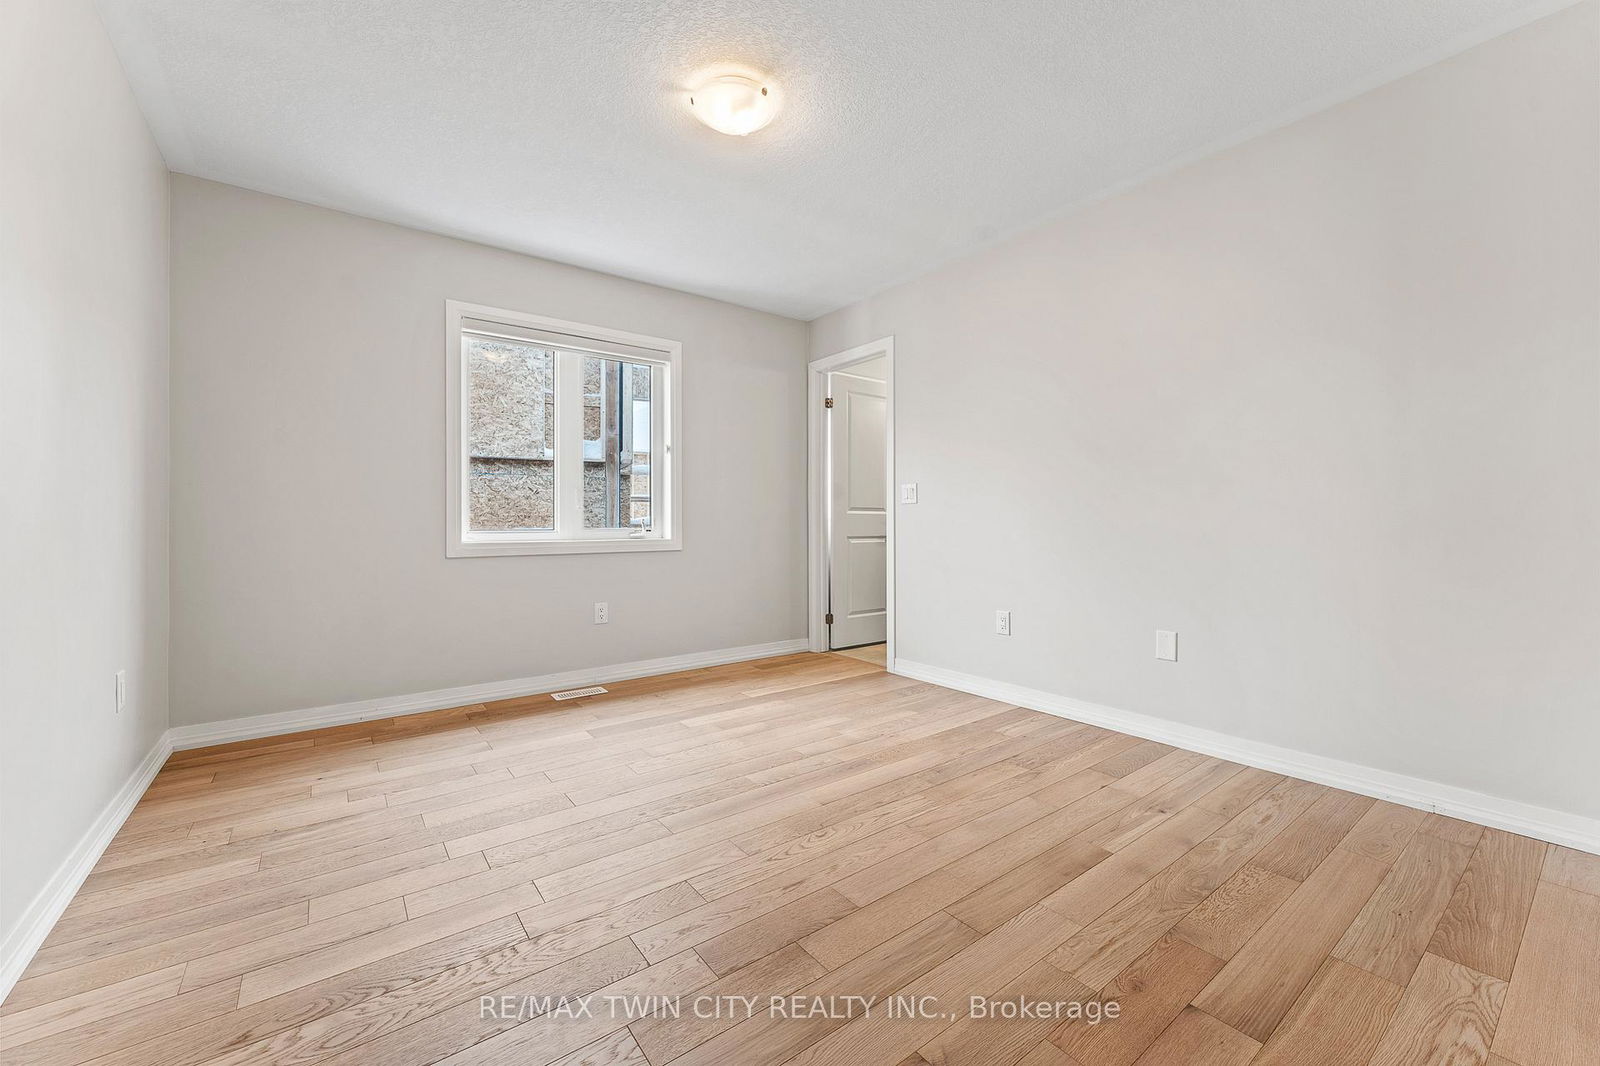
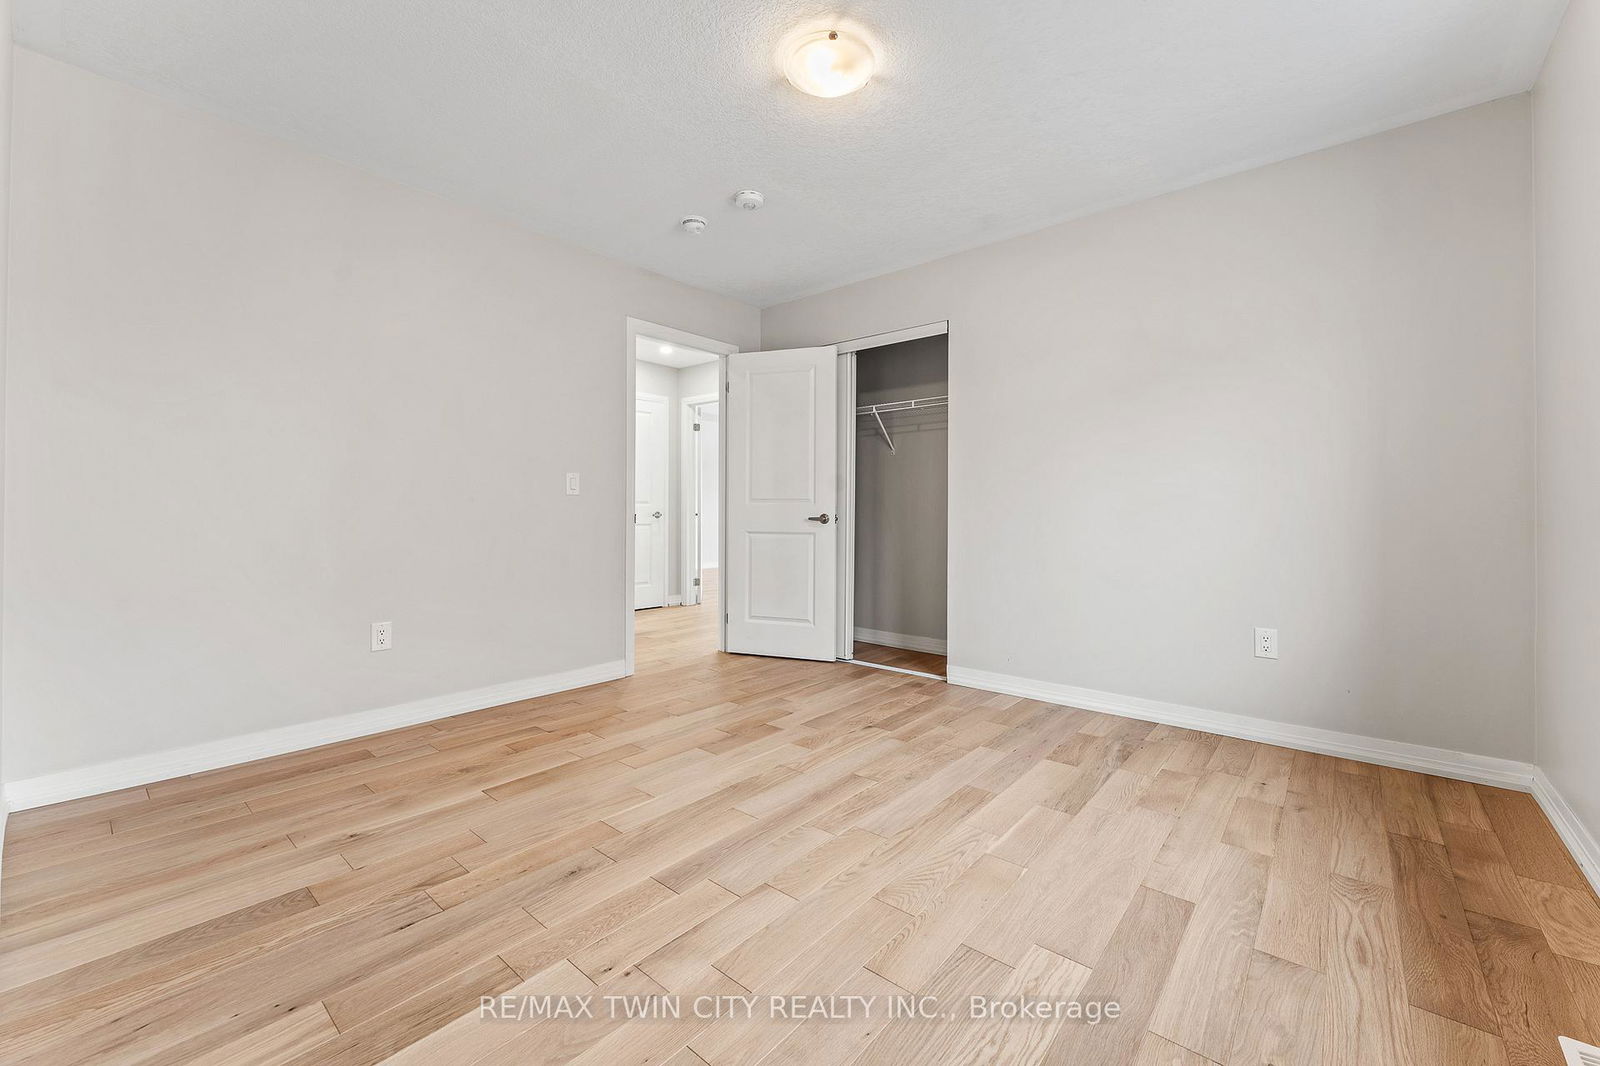
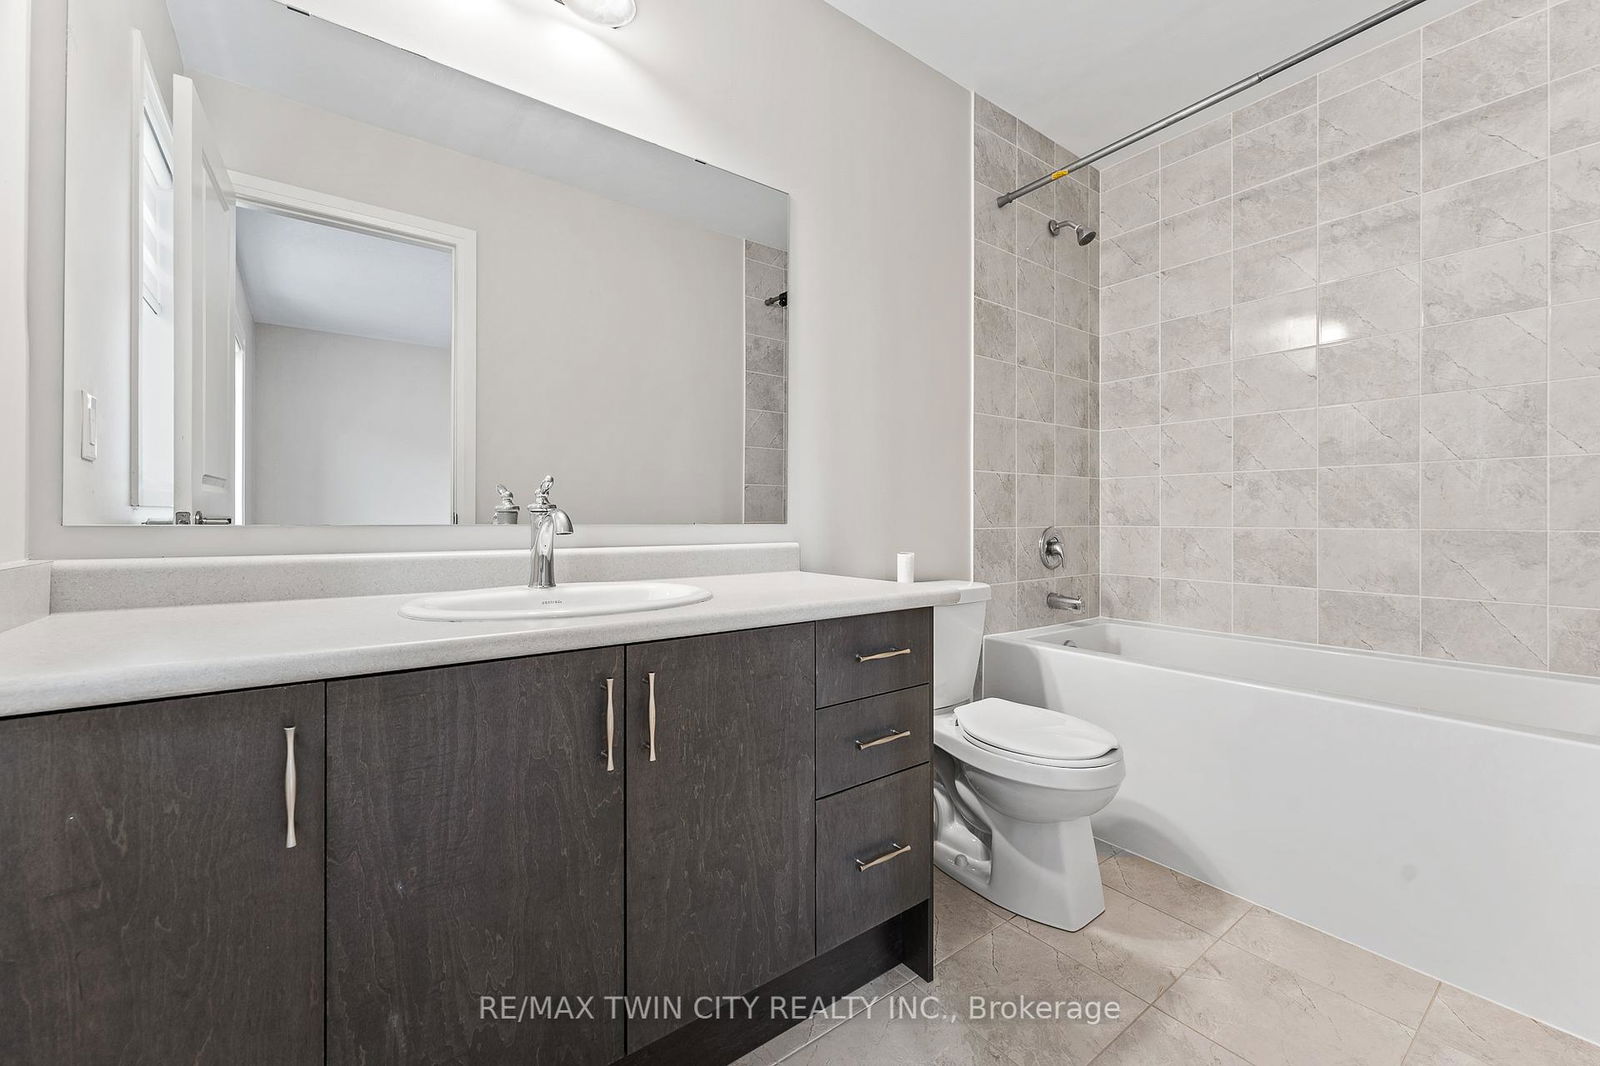
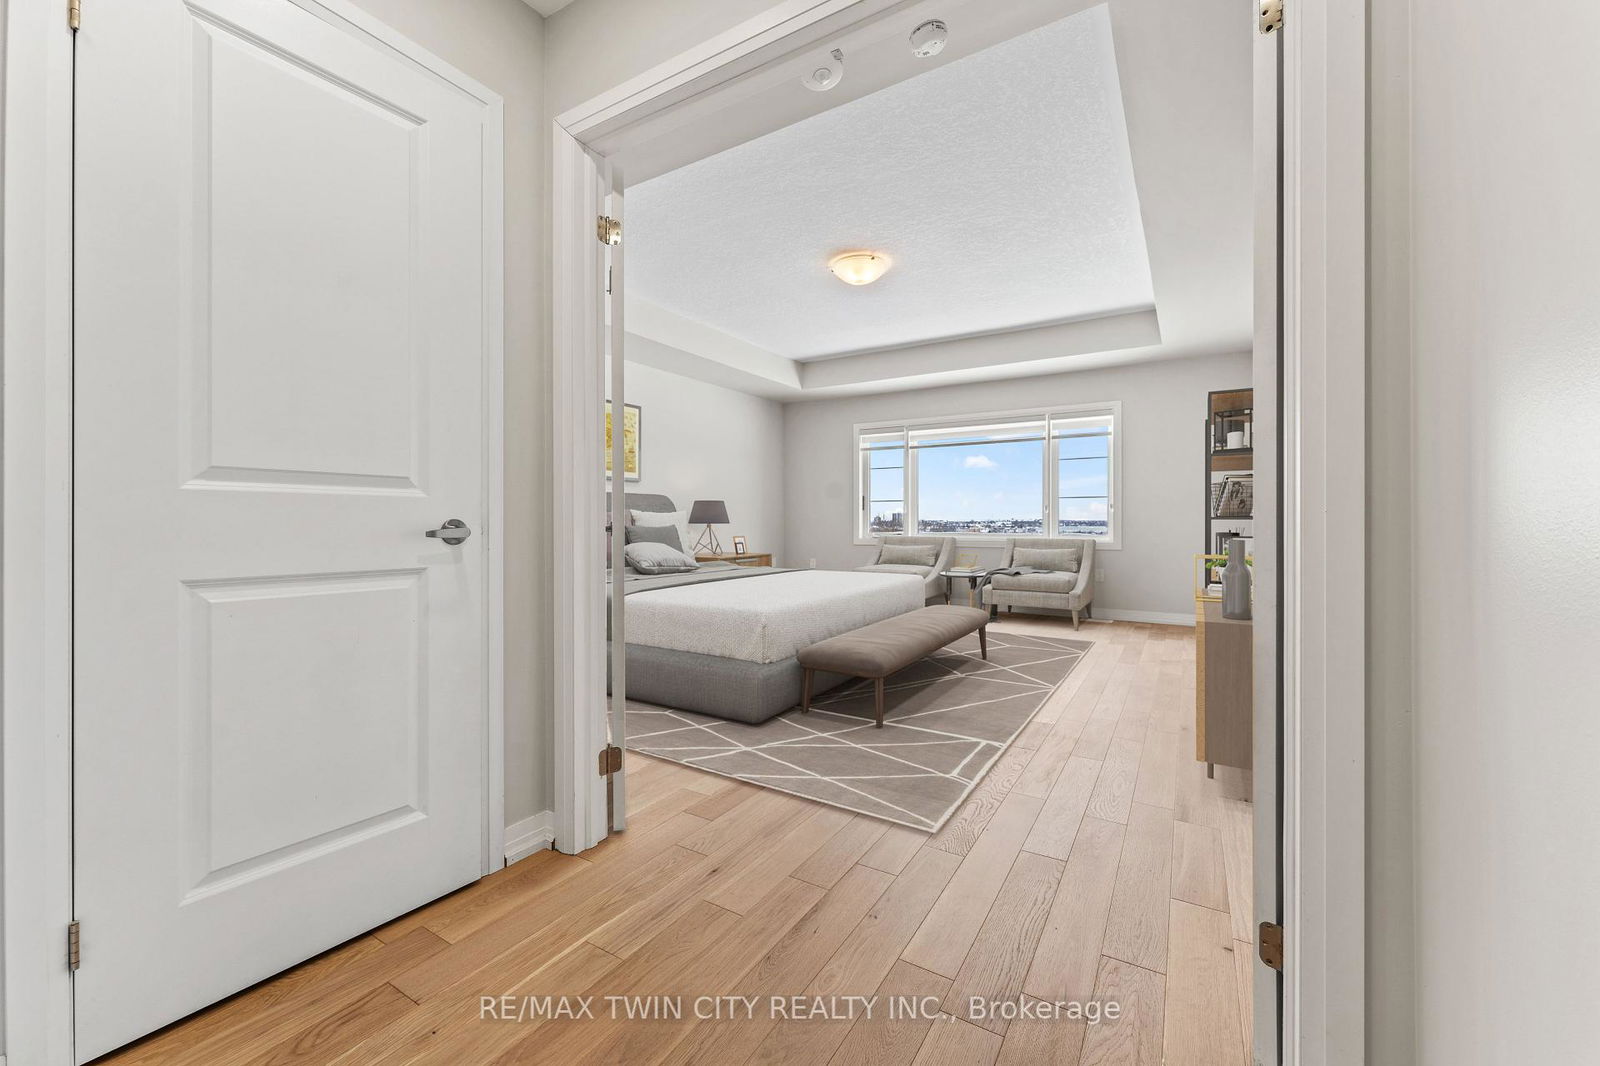
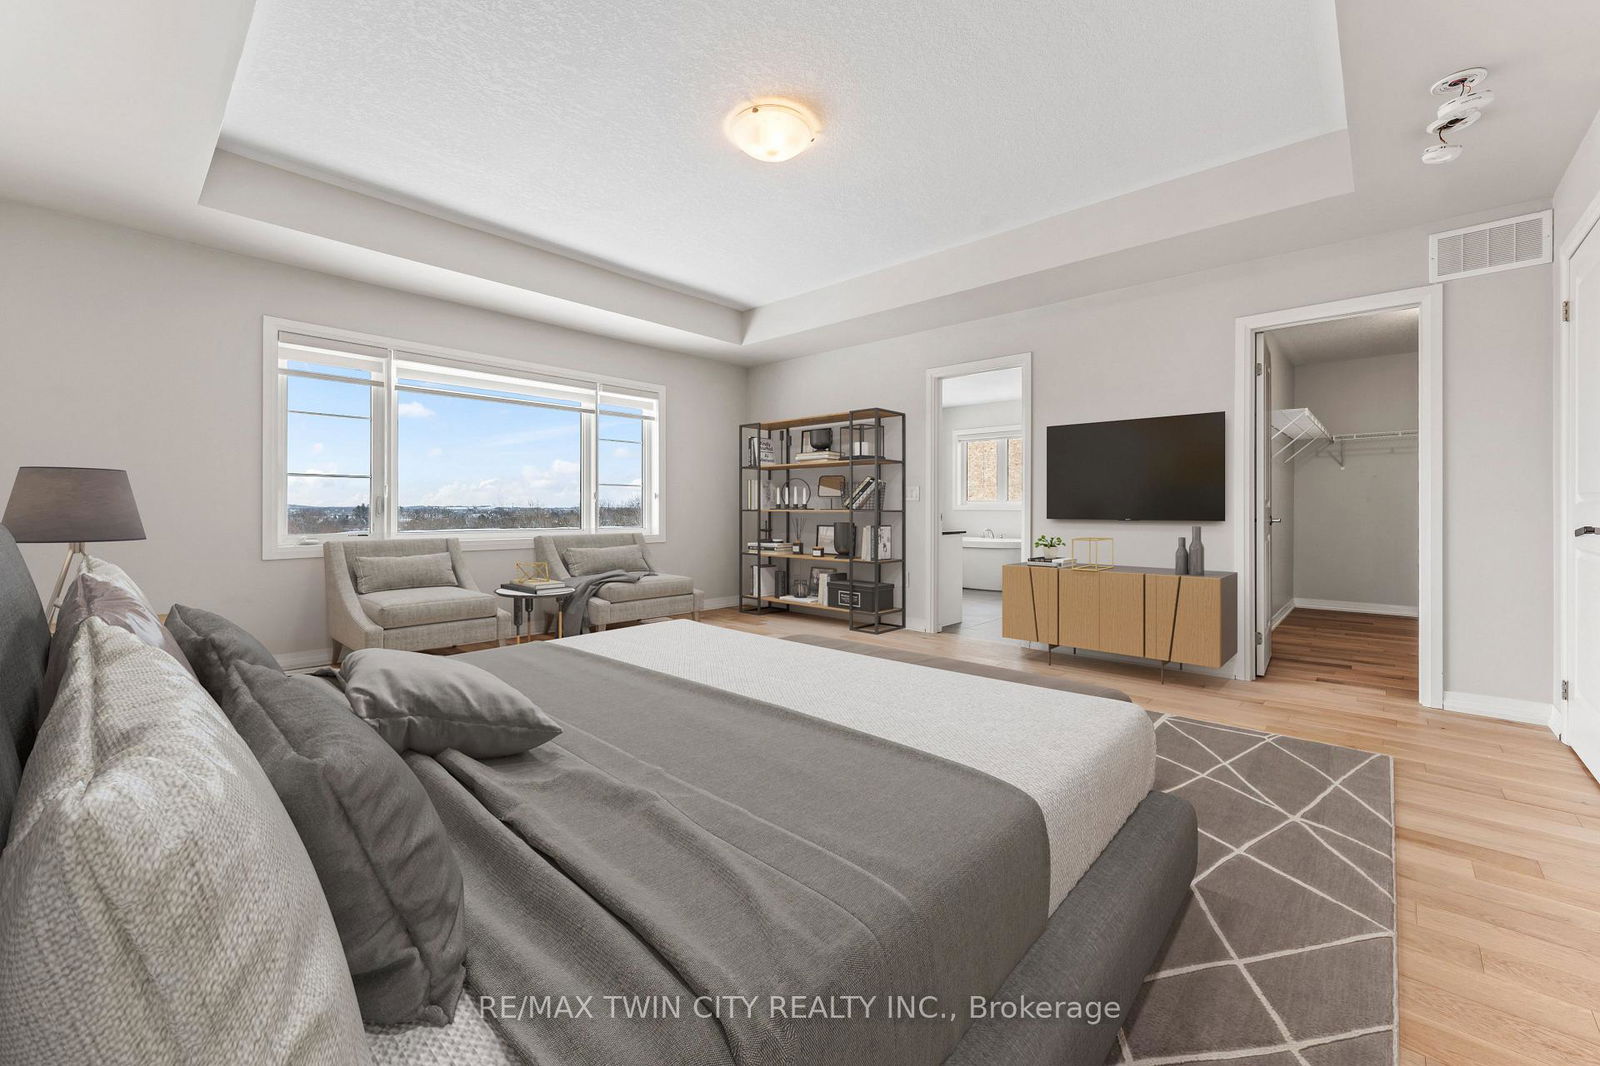
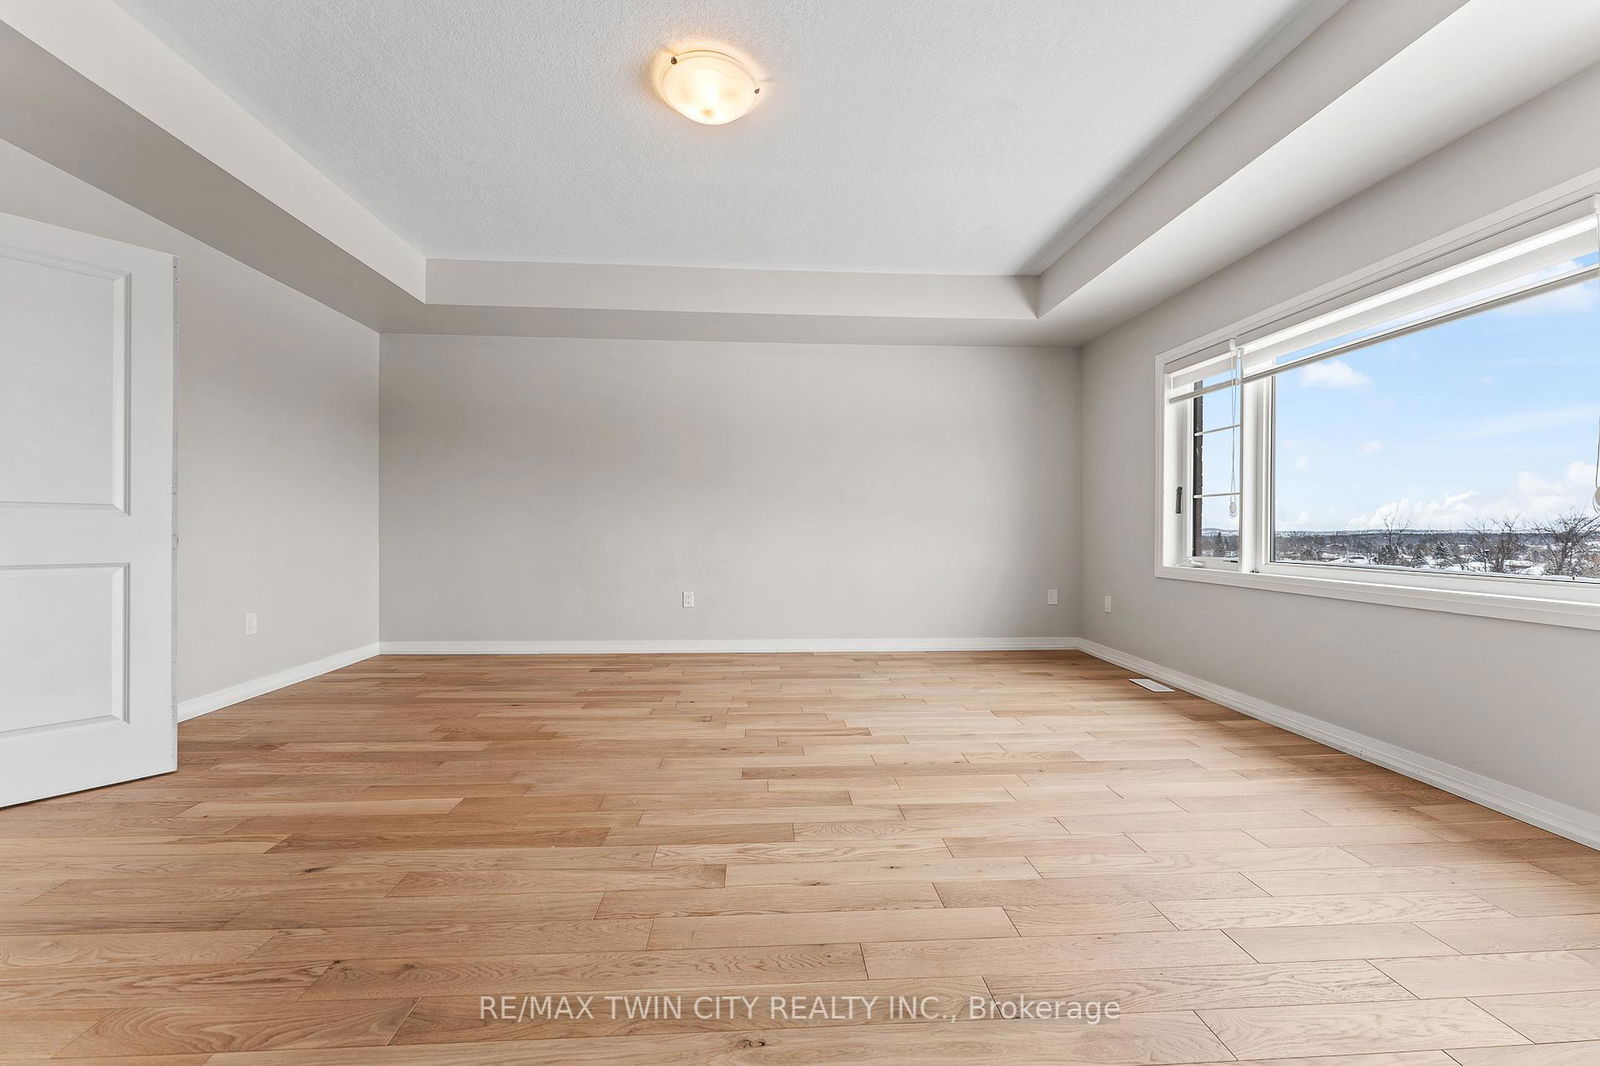
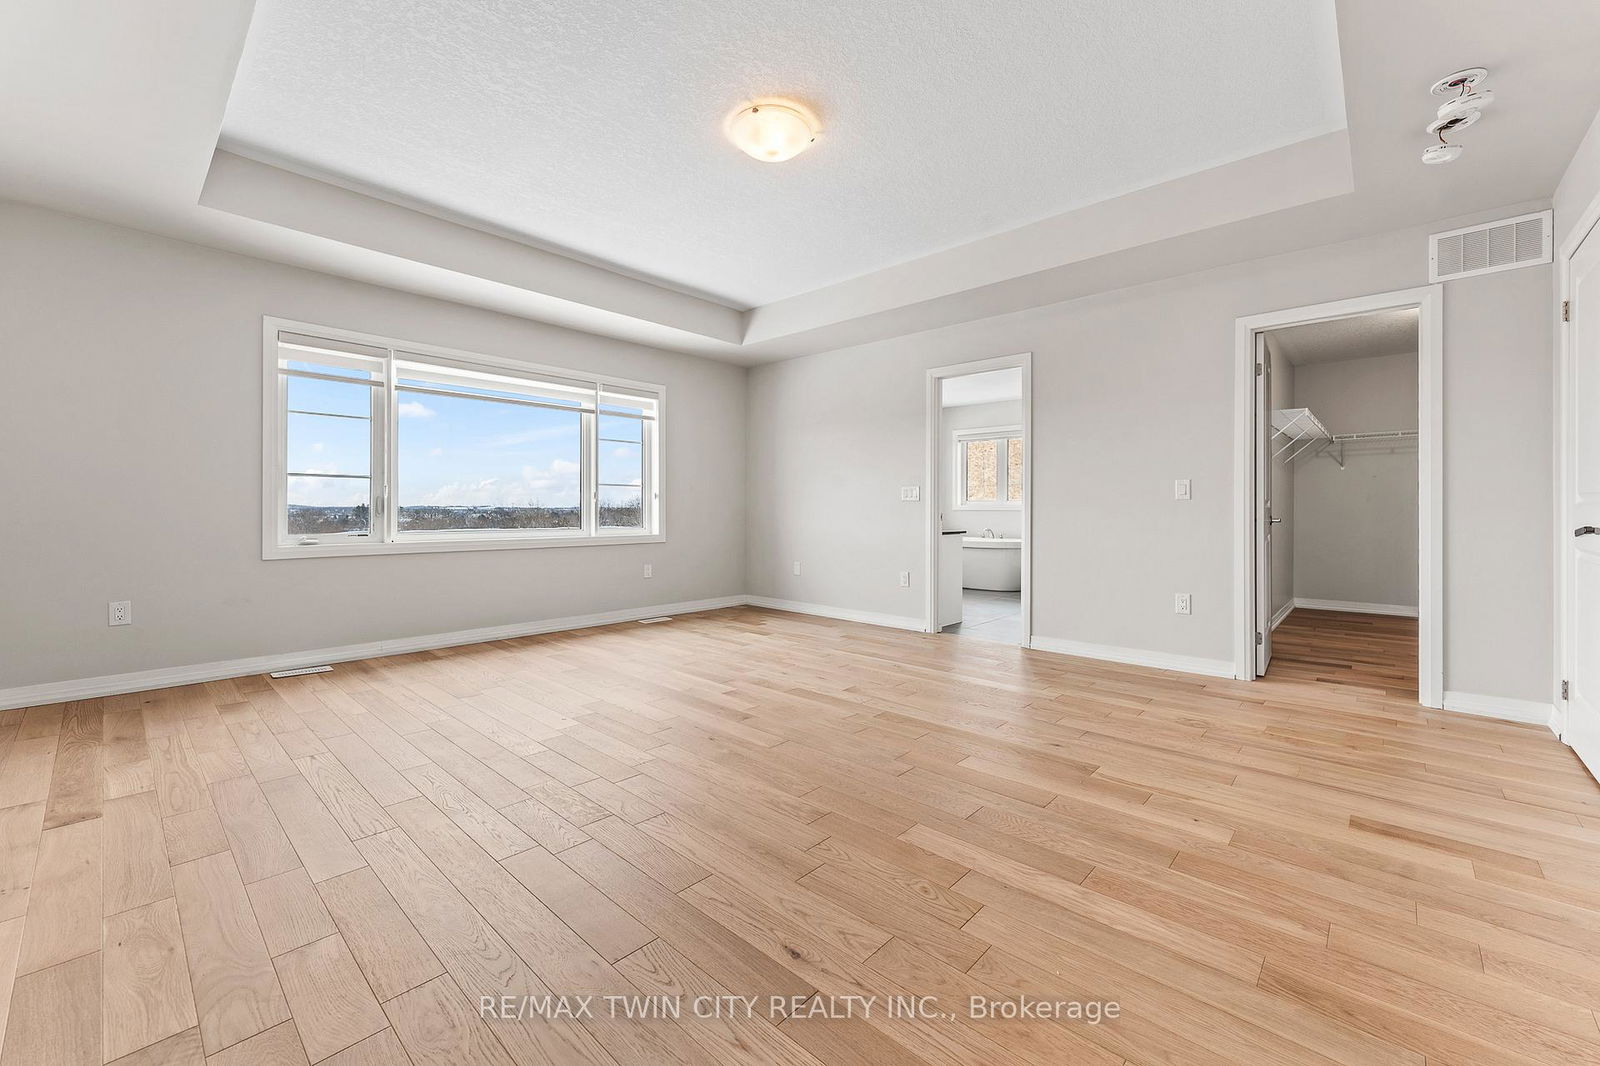
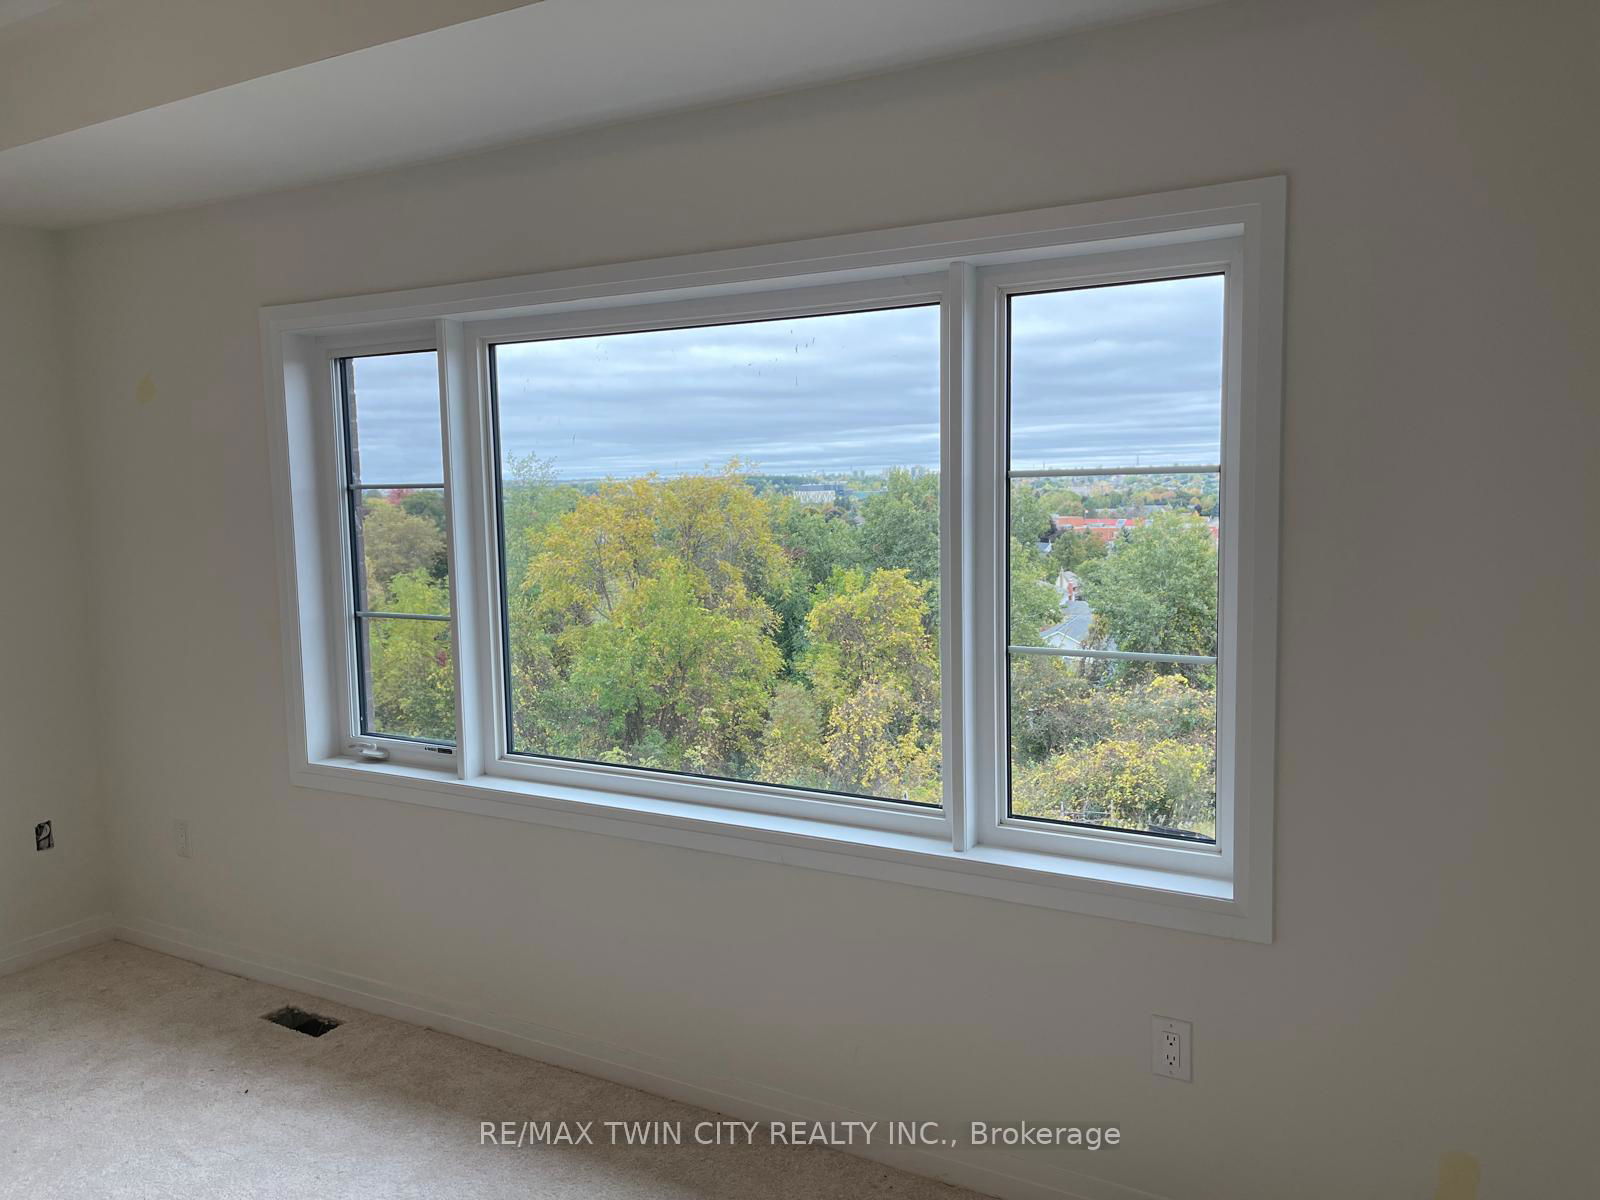
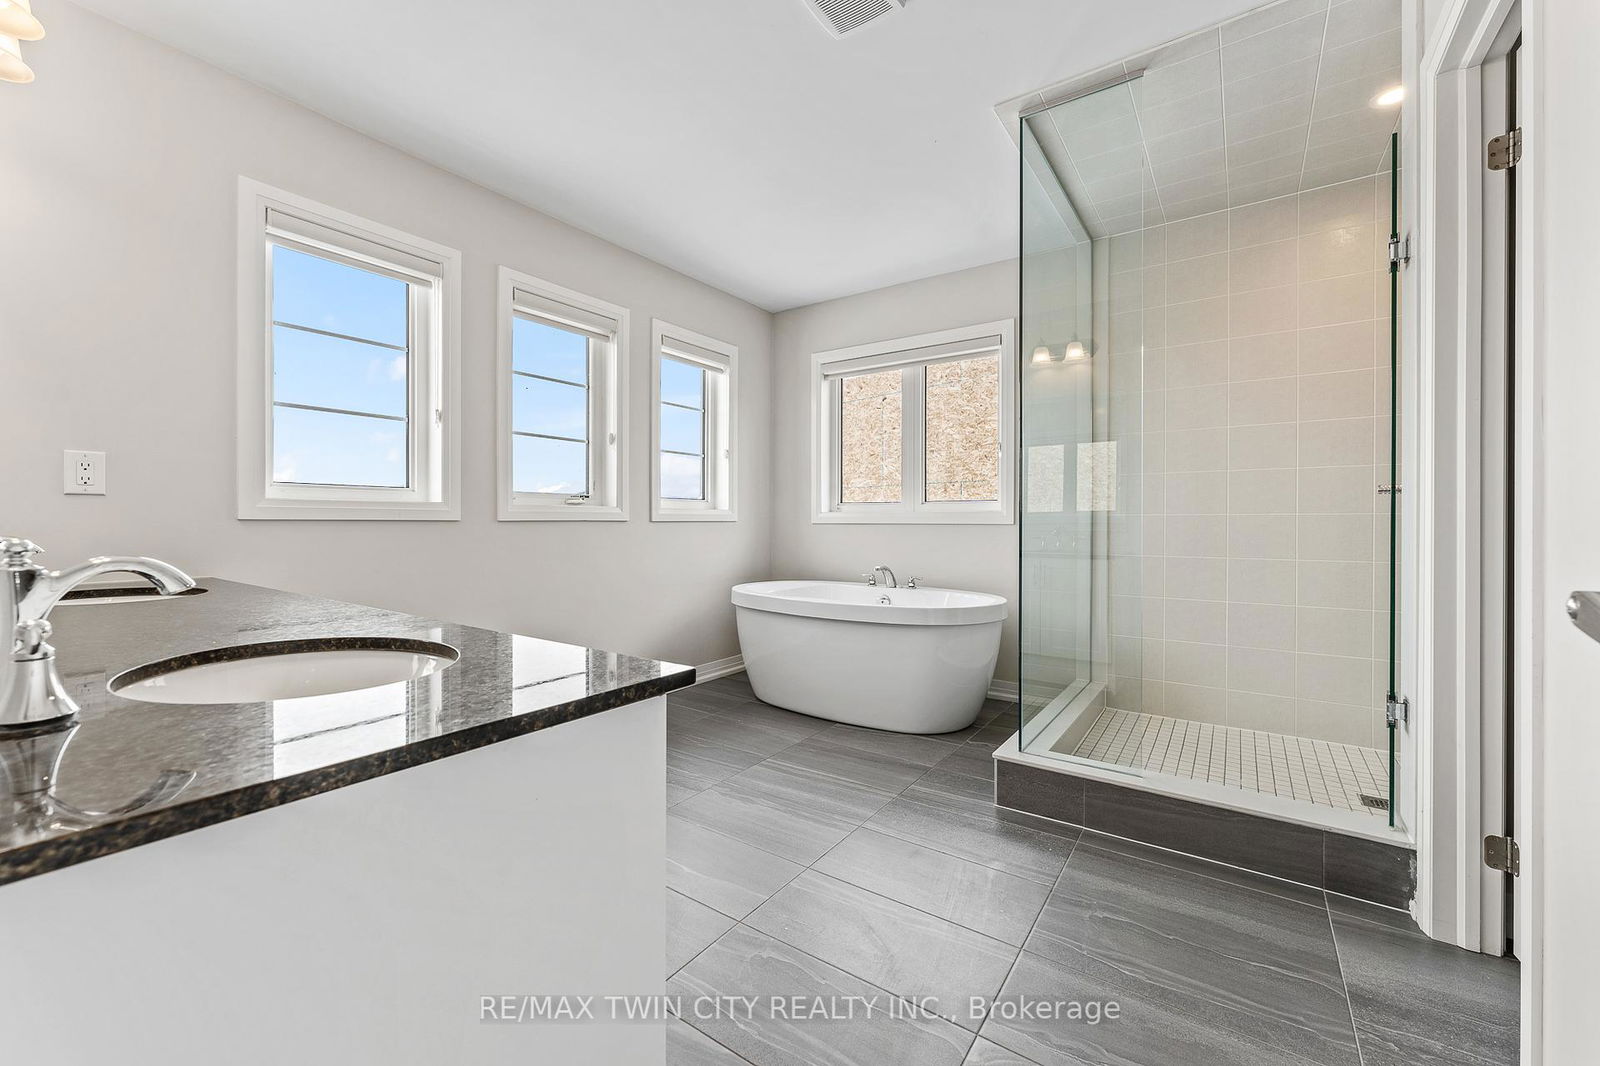
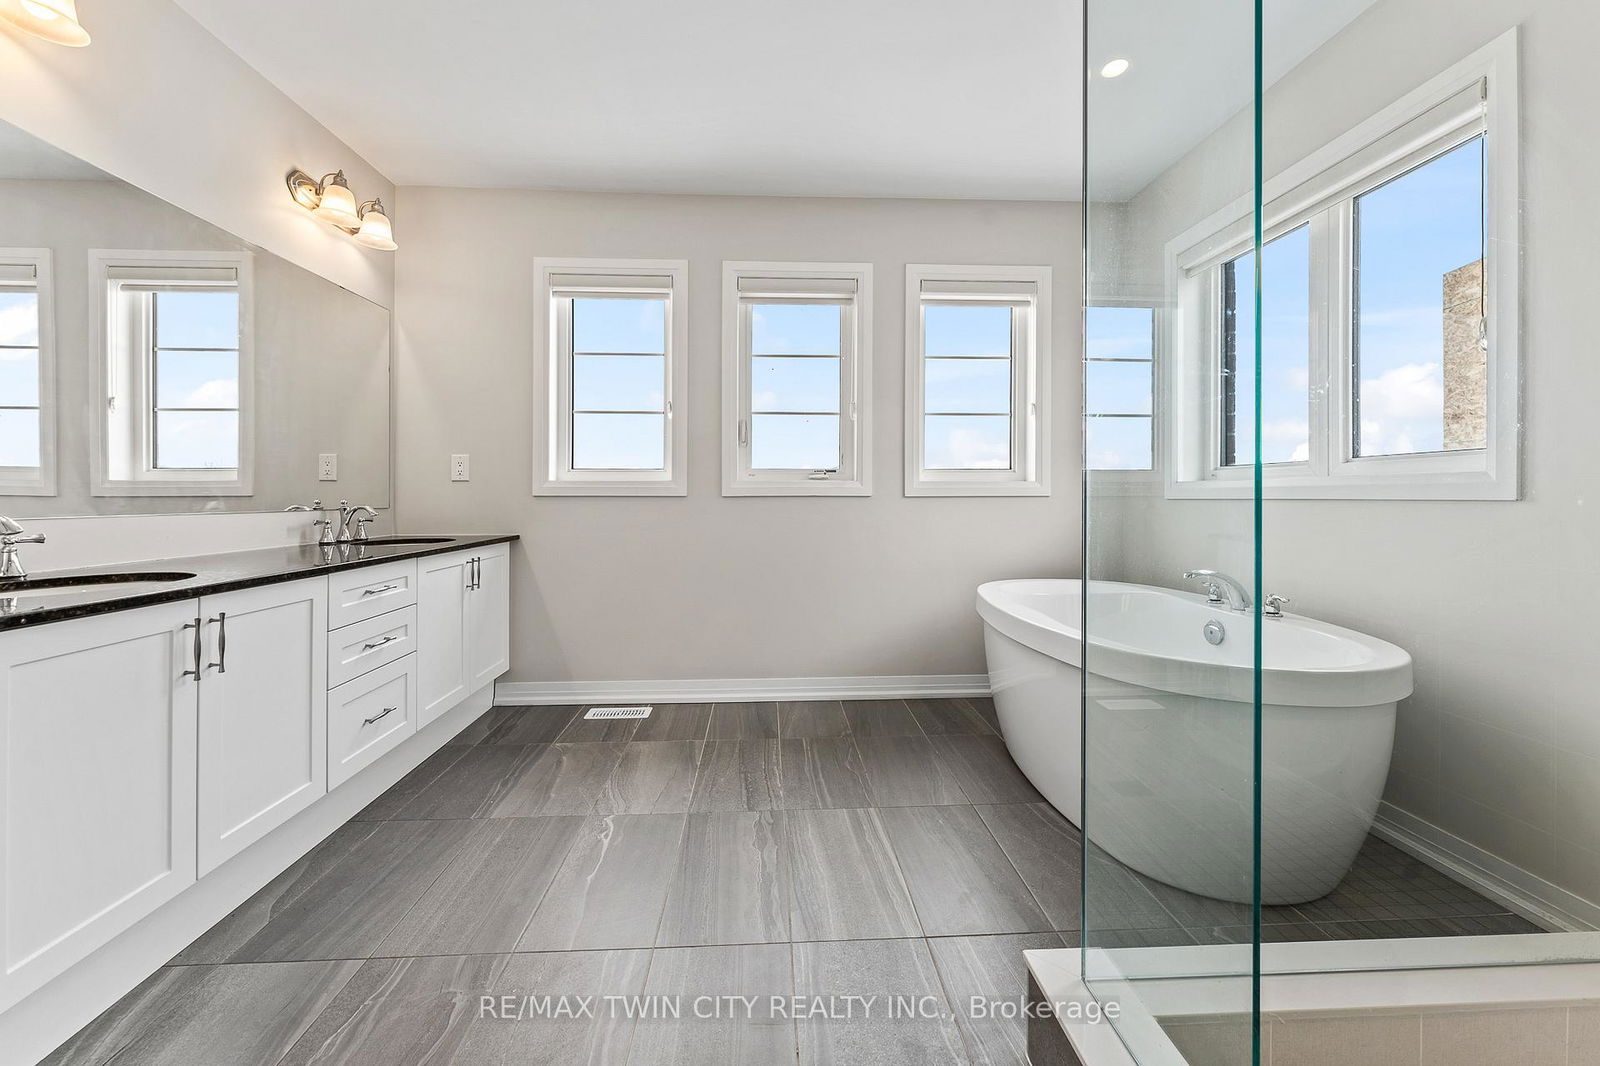
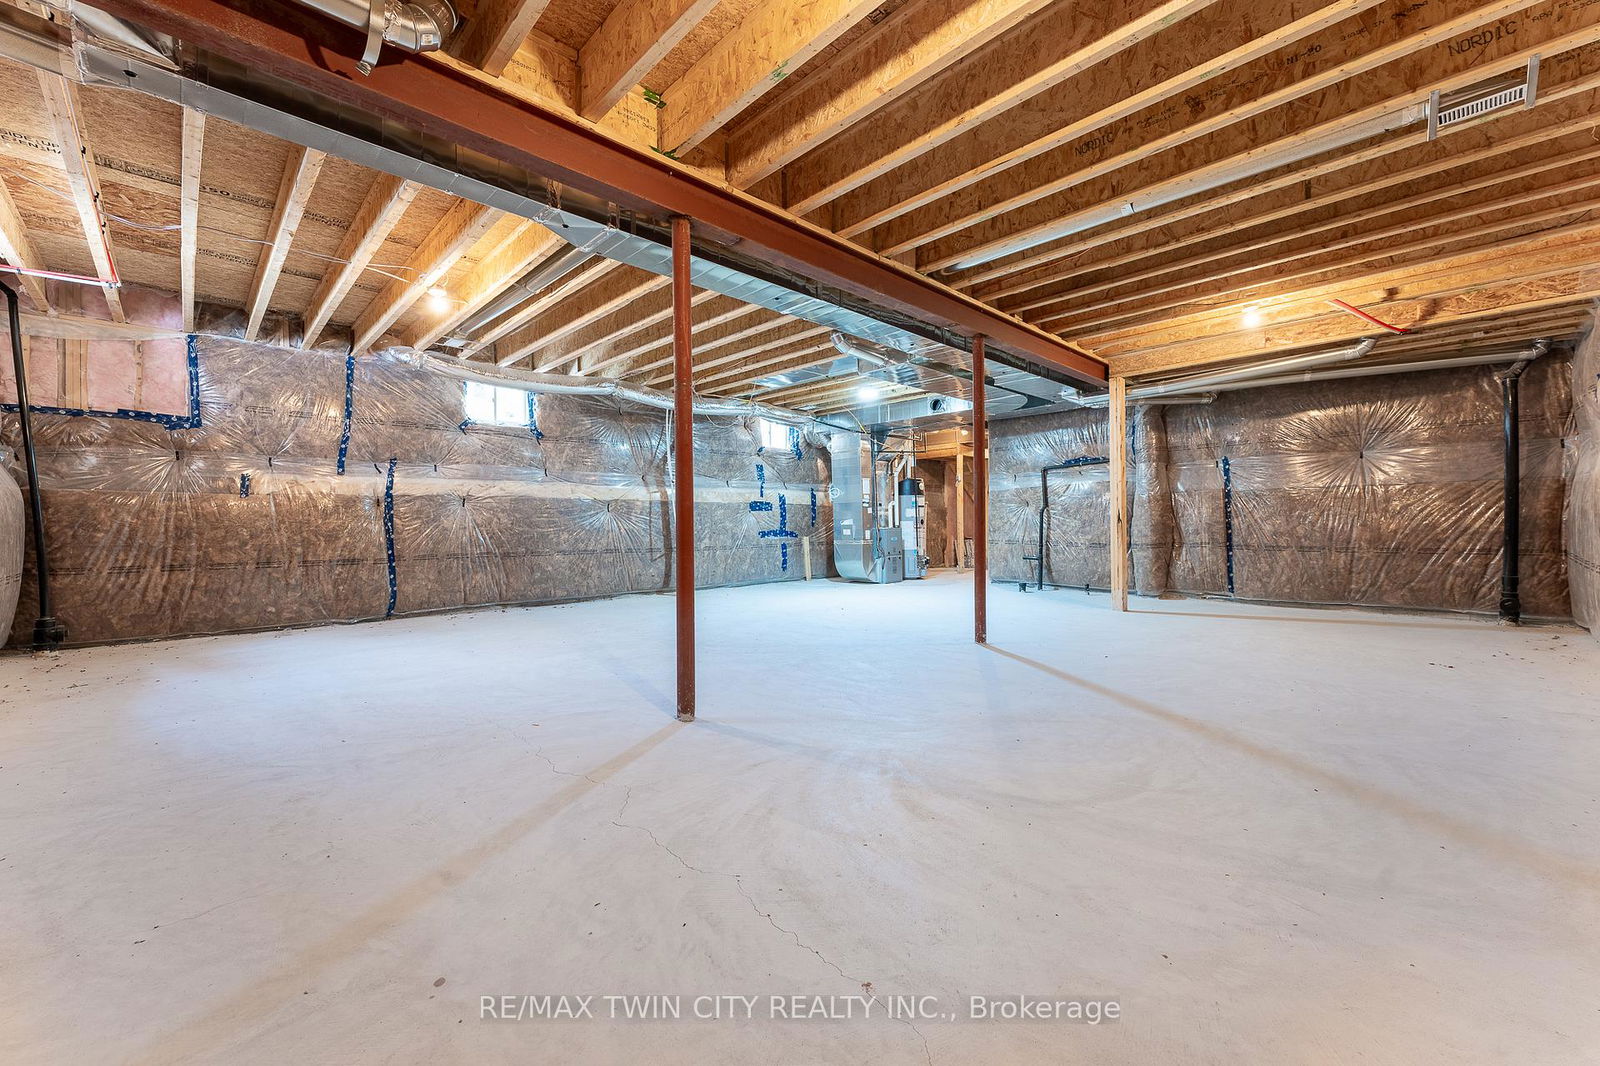
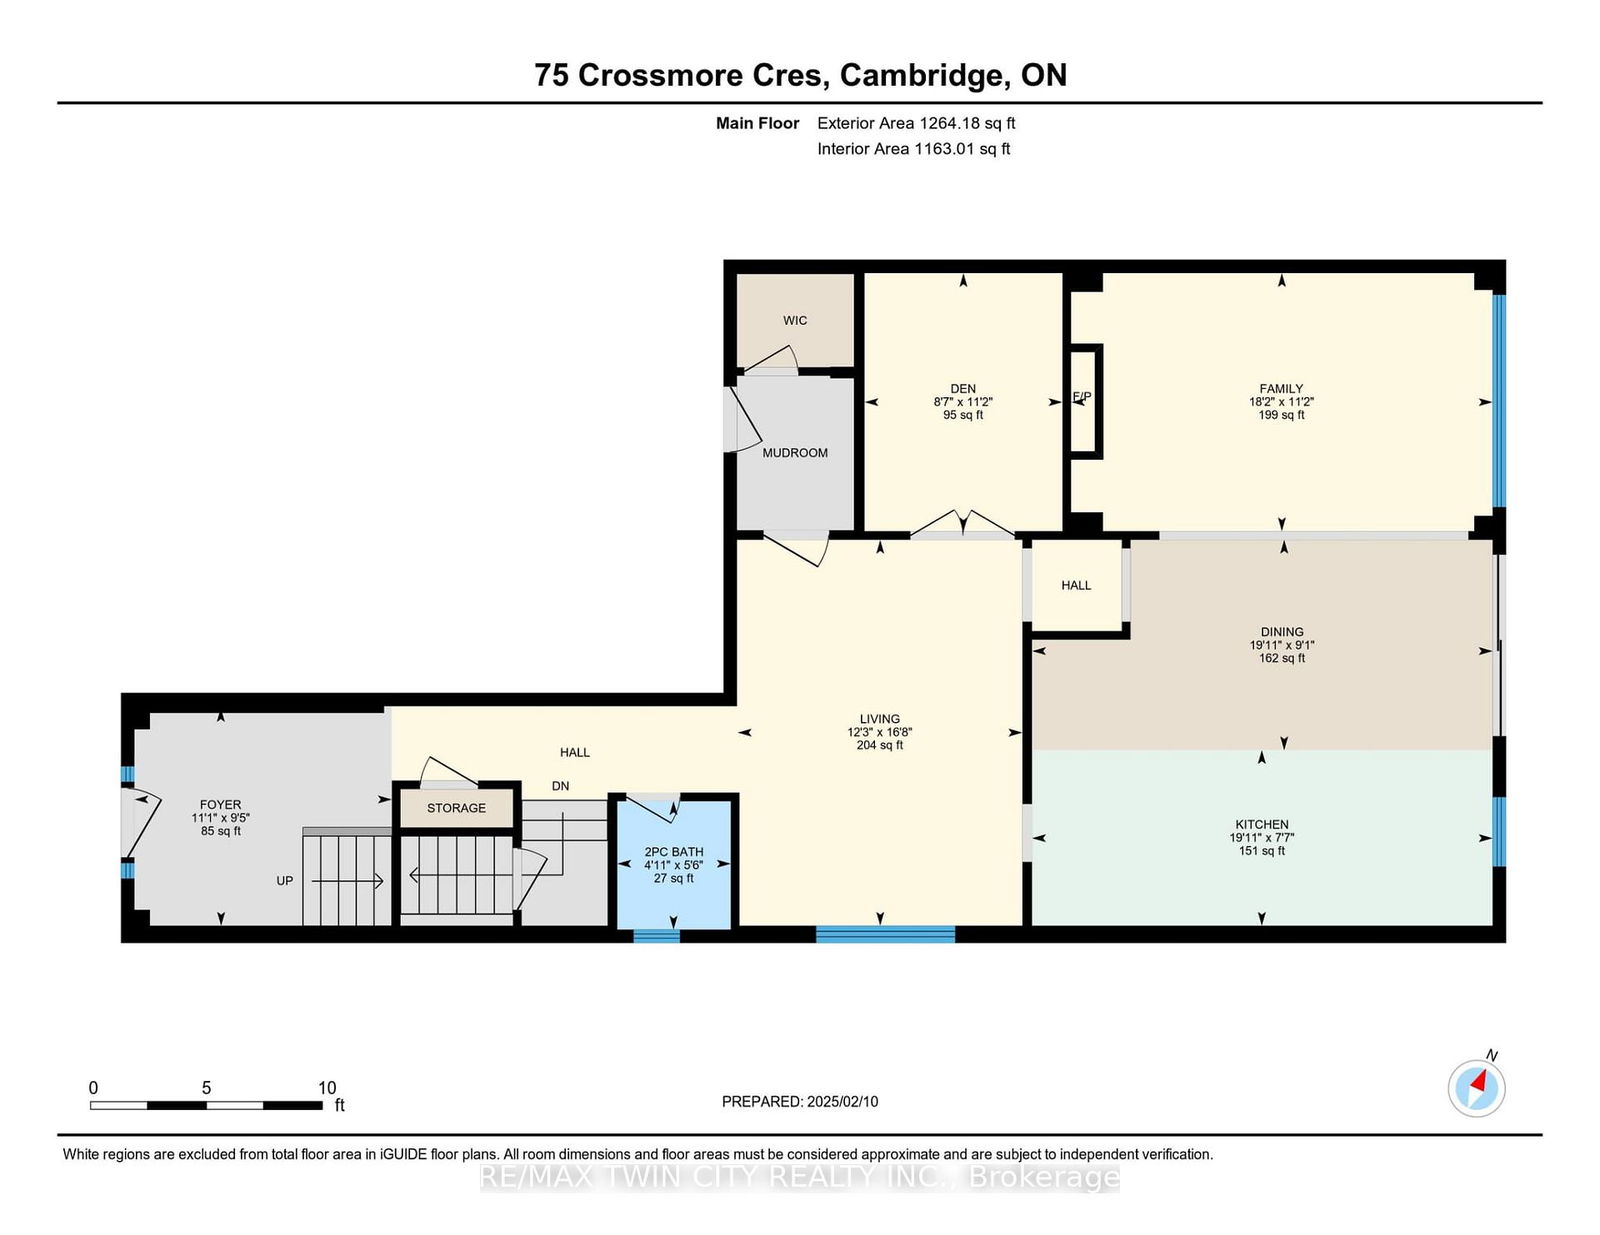
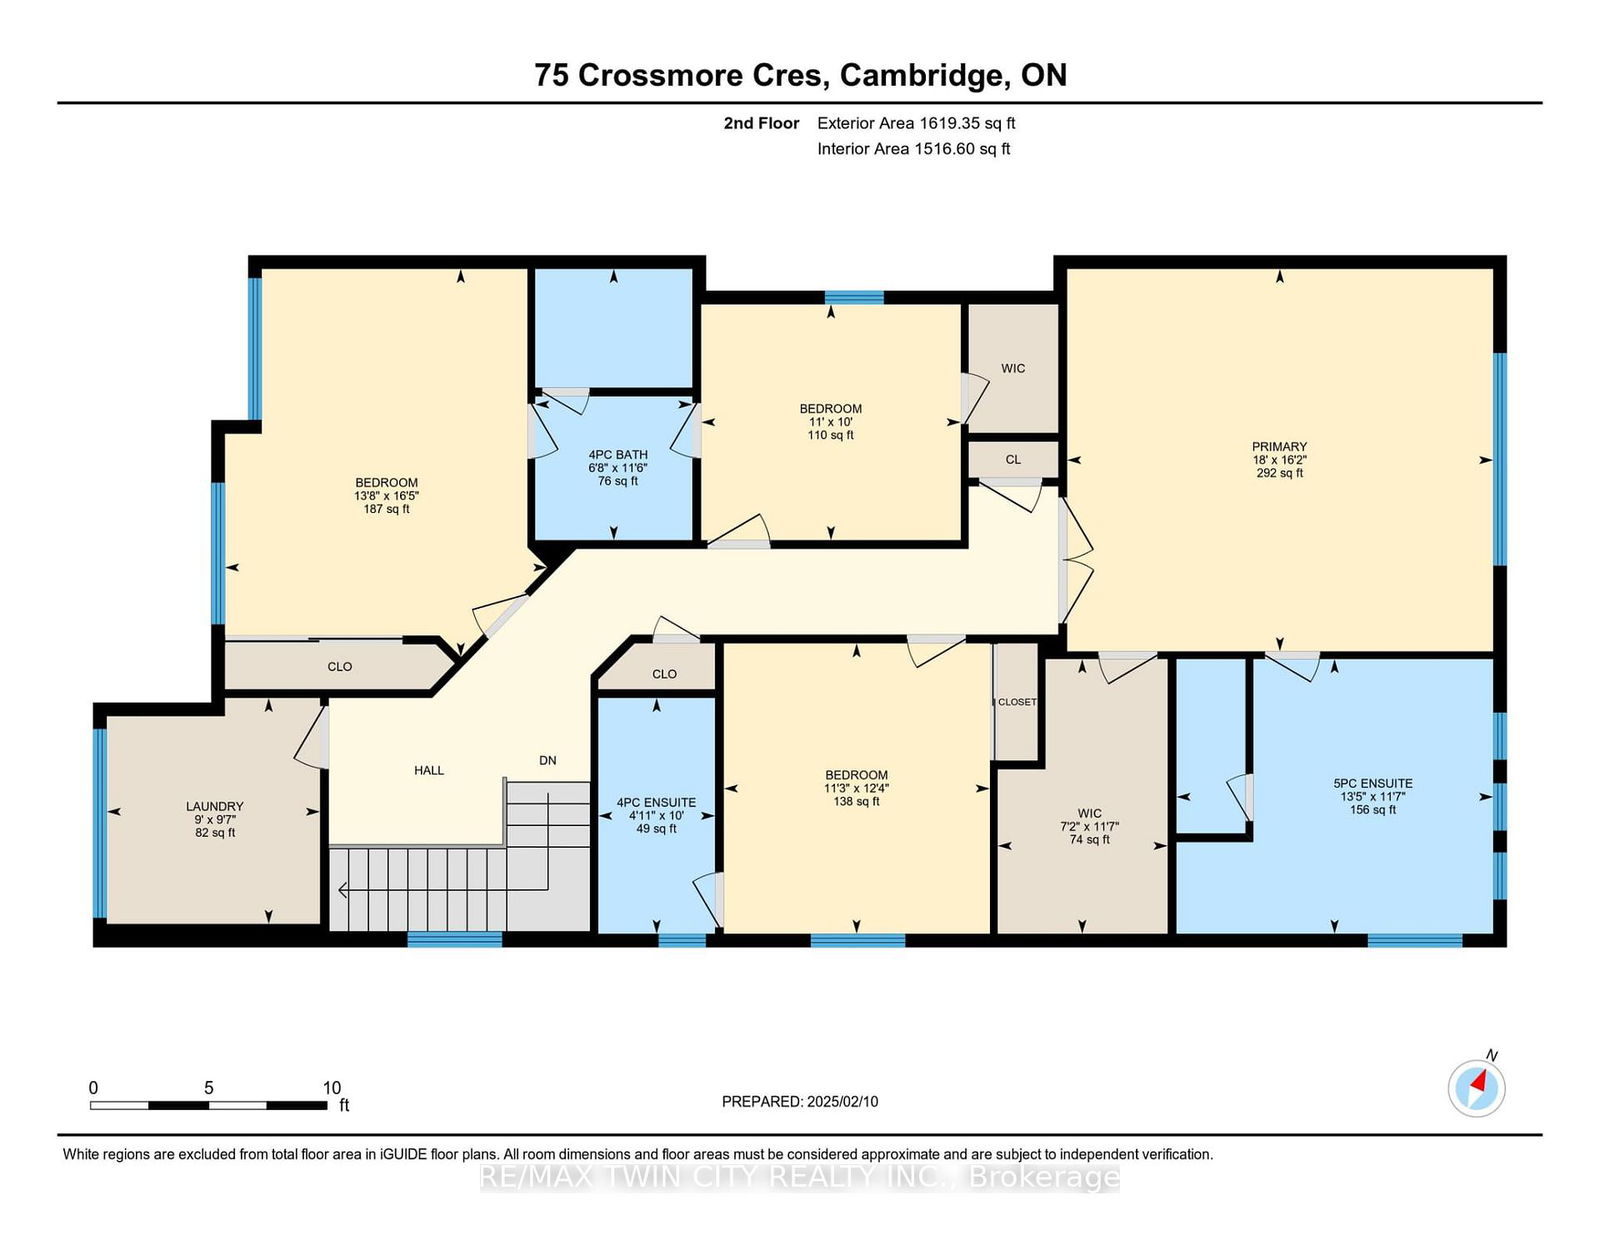
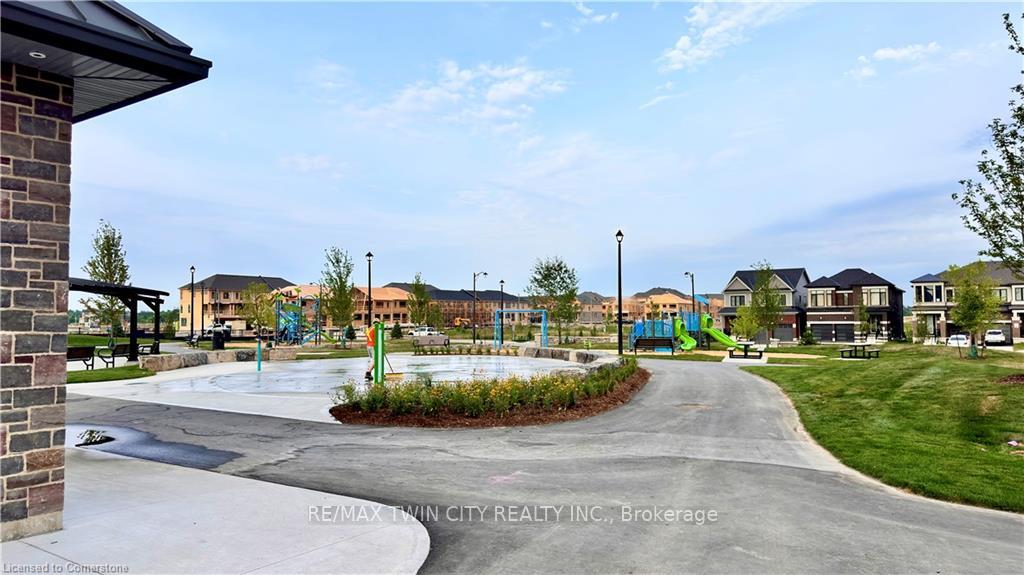
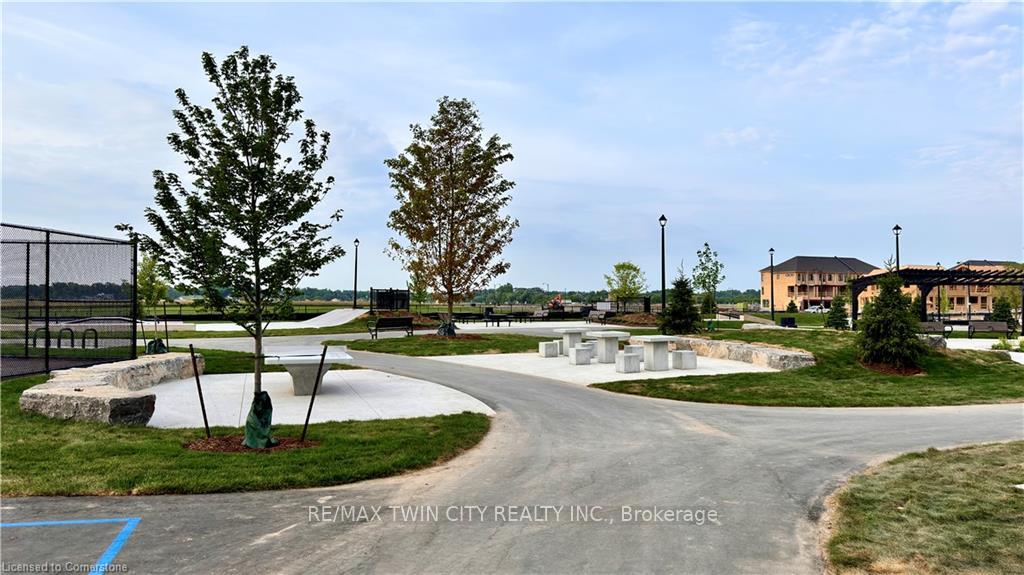
Your search finishes here. This is the largest 36' home available in the neighbourhood, backing onto a ravine lot with breathtaking views all year round with a walking trail taking you to a one of a kind community splash-pad park featuring a tennis court, skate park, dog park, basketball court and more. Welcome to 75 Crossmore. This home offers 4 bedrooms, 3.5 bathrooms, and 2,959 SQFT of living space. It also features a builder-upgraded, look-out basement with 9-ft ceilings a rare find. As you enter, you'll be greeted by 9-ft ceilings, upgraded pot lights throughout, and elegant upgraded tiles that lead you past the oak stairs into your dining room. The dining room then flows into your mudroom and library. Your spacious kitchen has everything you need, Extra large extended island with a subway tile backsplash, built-in stainless-steel appliances, and a Heavy-Duty 36" chimney hood fan. The kitchen opens to stunning private views, including a gas stove with a window looking out onto the natural surroundings. The open-concept kitchen flows seamlessly into the living room, which features a cozy gas fireplace and large windows. Moving to the second floor, which is entirely carpet-free, you'll find a spacious laundry room and 4 generously sized bedrooms, each with access to 3 full bathrooms. The primary bedroom boasts a luxurious 5-piece ensuite, while the second bedroom has its own 4-piece ensuite. Bedrooms 3 and 4 share a Jack & Jill-style 4-piece main bathroom. The untouched basement, featuring 9-ft ceilings, cold storage, and a rough-in for a future bathroom, is ready for your personal touch.
STOVE, CHIMNEY HOOD FAN, BUILT IN OVEN, FRIDGE, DISHWASHER, WASHER, DRYER, GARAGE OPENER X2.
Dining
Den
Living
Family
Kitchen
Br
2nd Br
3rd Br
4th Br
Bathroom
Bathroom
Bathroom
Laundry
The graph below compares the average list price and average sale price of homes in this neighborhood by month for the last 24 months. When average sale price is greater than average list price, this may suggest a buyer's market. When average sale price is lower than the average list price this may suggest a seller's market.
The graph below illustrates the average days on market for homes in this neighborhood. The yellow area may indicate a buyer's market, the green area may indicate a balanced market and the red area may indicate a seller's market.
Sales Representative, Century 21 People’s Choice Realty Inc., Brokerage
(647) 576 - 2100